


A new report from the Cambridge Centre for Alternative Finance (CCAF) at Cambridge Judge Business School provides an updated assessment of the environmental footprint of Ethereum, several years after the network switched its consensus mechanism from proof-of-work (PoW) to proof-of-stake (PoS) in a landmark event known as the Merge. Titled ‘Ethereum After the Merge – A Change in Power’, the report advances the earlier analysis by the CCAF through up-to-date hardware measurements and greater visibility into the underlying infrastructural composition of the network.
That the Merge slashed the energy use of Ethereum is well-established. When the network transitioned to PoS on 15 September 2022, the initial analysis by the CCAF recorded a substantial reduction in continuous power draw of more than 99.9% – from around 2.4 GW, comparable to the electricity demand of a small country, to a tiny fraction of that, lower than the power demand of the Eiffel Tower.
But Ethereum has not stood still since. A run of major protocol upgrades has changed how nodes handle data and how validators are organised. These shifts, combined with the availability of more granular network insights, prompted this revised assessment to ensure the ongoing robustness of the published estimates by CCAF.
Ethereum’s electricity consumption and carbon footprint today
The updated figures place Ethereum’s annual electricity consumption at approximately 7.87 GWh – the equivalent of roughly 0.90 MW of continuous power – and its annual climate footprint, once that electricity is traced through the grids supplying its nodes, at about 2.37 ktCO₂e. Both metrics sit broadly in line with earlier post-Merge estimates by the CCAF, confirming that the network’s footprint has remained comparatively low even as the total staked capital securing the protocol has expanded considerably, holding both metrics more than 99.9% below their final pre-Merge levels.
Alexander Neumüller, Research Lead at Digital Assets Energy & Climate Impact, CCAF, says: “The drop at the Merge is well documented. What matters now is keeping the picture accurate as the network evolves. The deeper point is conceptual: under Proof-of-Stake, electricity is no longer the price of security – what remains of Ethereum’s climate footprint now turns largely on the grids powering it, not the protocol.”

The drop at the Merge is well documented. What matters now is keeping the picture accurate as the network evolves. The deeper point is conceptual: under Proof-of-Stake, electricity is no longer the price of security – what remains of Ethereum's climate footprint now turns largely on the grids powering it, not the protocol.
A more precise measurement of Ethereum’s electricity use
The primary advance in this assessment is methodological: rather than relying on theoretical assumptions, the framework executes a bottom-up infrastructural audit. Because a full Ethereum node requires two distinct software applications – an execution client and a consensus client – running simultaneously on a single machine, physical power demand varies according to the specific software combination used. To capture this variance empirically, the measurement programme profiled 20 different client combinations across two reference hardware configurations.
These configurations represent the operational spectrum of the network: a lightweight residential setup typical of a home operator, drawing a median of 18 watts, and a workstation-class machine used in professional deployments, drawing a median of 152 watts. To establish a true network-wide baseline, these direct wall-plug metrics were scaled across the approximately 8,522 discoverable nodes sustaining the network using real-world hosting data. With roughly 36% of nodes operating on residential hardware and 64% hosted within cloud or enterprise data centres, the final network-weighted average is established at approximately 105 watts per node, close to the power draw of a standard laptop.
Bryan Zhang, Co-Founder and Executive Director at CCAF says: “Consistent with CCAF’s mission, we hope this updated, measurement-based assessment gives policymakers, industry and the public a more accurate and transparent foundation for understanding the environmental profile of public blockchains – and how it continues to change.”

Consistent with CCAF's mission, we hope this updated, measurement-based assessment gives policymakers, industry and the public a more accurate and transparent foundation for understanding the environmental profile of public blockchains – and how it continues to change.
The electricity mix behind Ethereum’s carbon footprint
To an Ethereum node, every kilowatt-hour is interchangeable. To the global climate, the source of that kilowatt-hour is what matters. The model captures this by mapping the physical infrastructure of the network, pinning each node to the carbon intensity of the grid in its host country. The resulting picture is concentrated but not monolithic: the United States (31%), Germany (16%), Finland (8%) and France (6%) together host about 62% of full nodes.
Weighted across those particular grids, approximately 56.4% of the electricity powering the network comes from sustainable sources: renewables and nuclear. A notably higher share than the roughly 43% those sources supply worldwide. As these host grids decarbonise over the coming years, the network’s emissions are expected to fall commensurately, even if absolute electricity consumption holds steady. Separately, active research into stateless verification could eventually lower the hardware barrier enough to run nodes on devices as small as smartphones. While this would slash individual power demand, a consequent surge in operator participation leaves the net impact on the network’s aggregate footprint genuinely open.
Download the report
Explore the report – ‘Ethereum After the Merge – A Change in Power’.
Download your free copy of the report
You can track the live figures on the Cambridge Blockchain Network Sustainability Index (CBNSI).
Related articles

Research centre news
Paying for Bitcoin’s security as the subsidy fades
The Cambridge Centre for Alternative Finance has published Funding Bitcoin's Future, a study examining how network security will be funded as the programmed block subsidy falls toward zero. The report analyses fee market dynamics, evaluates attack economics, and introduces a framework to monitor security budget health over time.
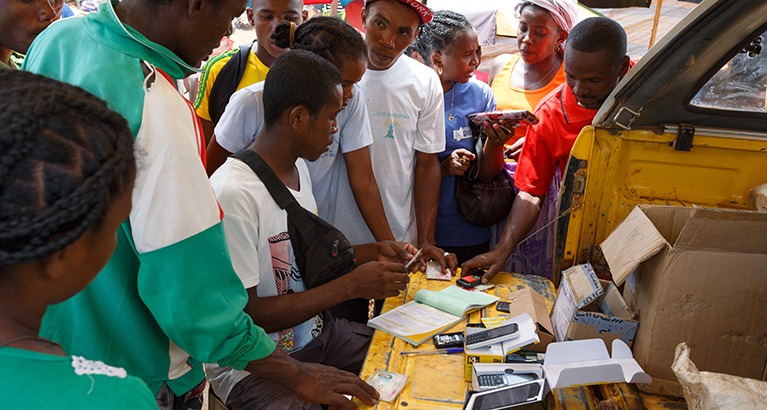
This article, by Pavle Avramovic, Gabriella Gebri and Aishwarya Viswanathan, examines the governance challenges shaping the next generation of digital identity systems. Based on cross-regulatory dialogues in Uganda and Ethiopia, it explores how stronger coordination, interoperability, and trust can unlock the full potential of digital identity and e-KYC across sectors.

Research centre news
New global survey maps e-KYC and digital ID adoption
Financial Innovation for Impact (Fii) in collaboration with the Cambridge Centre for Alternative Finance (CCAF), has launched the Global e-KYC Landscape Study. It captures intersecting perspectives of public authorities, regulators and supervisors, and industry (fintechs, banks, other financial institutions and digital ID service providers) via 2 parallel surveys. The resulting insights will provide a holistic view of e-KYC landscape and adoption dynamics today.