

By Nam Nguyen, CERF/CCFin Research Associate, Cambridge Judge Business School, University of Cambridge
Investors charge polluters more, and the charge has grown
When investors demand a higher return to hold the shares of polluting firms, those firms pay more for their capital. This wedge – the greenium – is a gauge of how markets price climate risk. In principle, it is also a lever: costlier funding should push brown firms to clean up.
Measured with realised returns, even the sign of the greenium has been disputed. A decade of money flowing into green assets pushed up their prices, so green stocks earned high returns even though investors expected less from them. Forward-looking measures cut through this noise. They use firms’ implied cost of capital: the discount rate that equates a firm’s share price with analysts’ forecasts of its future earnings.
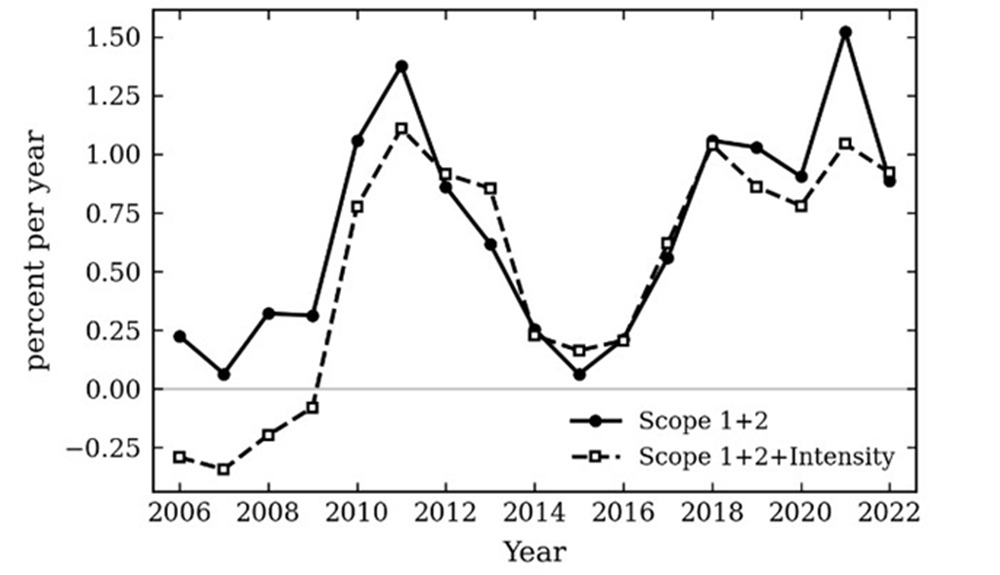
Figure 1 shows the resulting spread between brown and green US firms in the same industries. On the paper’s main classification (the dashed line), it averaged about 31 basis points a year over 2006 to 2015 and about 78 over 2016 to 2022 (a basis point is a hundredth of a percentage point).
Yet green innovation by brown firms has fallen
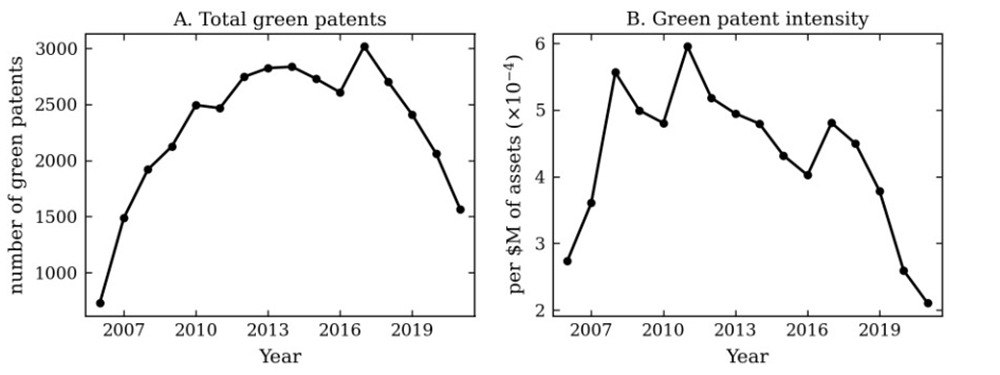
If a higher cost of capital worked as intended, brown firms would be innovating their way out of it. Figure 2 shows the opposite. The number of green patents filed by brown firms peaked in 2017 and fell in every year to 2021. Per dollar of assets, their green patenting more than halved over the same 4 years, even as the greenium rose.
Three forces behind the greenium
To explain both facts together, the paper builds a general-equilibrium model of an economy with a brown and a green sector. Brown output is hit from time to time by climate-policy actions, mostly tightenings but occasionally rollbacks. These actions arrive more often the larger the brown sector’s share of the economy. The greenium then splits into 3 components:
1
Policy
Compensation for the brown sector’s exposure to policy tightening. It is the largest component, and it climbs steeply as brown comes to dominate because shocks become more frequent and, with the brown sector so large, each one hits the whole economy.
2
Diversification
Brown shares move more closely with aggregate wealth than green shares. That makes them the poorer diversifier of the market portfolio, so they must offer a higher return.
3
Hedging
A smaller force running the other way. Investors value an extra dollar of wealth more as the brown share rises, and brown shares tend to gain more than green shares at exactly those times, so investors accept a lower return on them.
I take this decomposition to a panel of US firms’ implied costs of capital from December 2007 to December 2021, measuring each exposure directly. Comparing firms of similar size, brown firms’ cost of capital is 66.7 basis points a year above green firms’. Policy risk contributes 31.9 basis points and diversification 18.2, together about three-quarters of the gap. The hedging component has the sign the model predicts but, at −0.6 basis points, is too small to tell apart from zero. The ordering the model predicts is the ordering the data deliver.
Why the pressure misfires
Brown firms in the model can respond to the cost-of-capital pressure in two ways. They can mitigate, lowering how often policy shocks hit them, or transition, converting brown capital into green. The paper’s central result is that both responses are misaligned with the premium that drives them.
Mitigation is strongest while the brown sector is a minority of the economy and the policy premium is mild, and it switches off exactly where the premium is largest. While brown is a minority, a policy shock destroys some brown output but barely moves the wider economy, a loss a firm is glad to make less frequent. Once brown dominates, the same shock hits aggregate consumption, and investors value each dollar paid out in that state far more. In investors’ valuation, that extra worth offsets much of the output the shock destroys, so making shocks rarer no longer repays the output that mitigation uses. Brown firms abate least in exactly the states where the policy premium is steepest.
Transition chases the valuation gap between green and brown firms, which widens with the greenium. But it builds on a green knowledge base that thins as the brown sector grows, so it too is capped and declining where the premium is strongest.
Mitigation switches off exactly where the policy premium is largest
Calibrated to US data for 2006 to 2022, the model traces the rise of the greenium and the fall of green innovation after 2016 to the same event. In the calibration, brown firms produce about 82% of output in 2006 and mitigation stops once that share passes about 85%. The policy rollbacks of 2017 to 2020 push the brown share past that point. Investors still expect policy to tighten on net, so the larger brown sector then faces more frequent policy actions at full force, and the policy premium rises. The calibrated greenium averages 47 basis points over 2006 to 2015 and 78 over 2016 to 2022, against 31 and 78 in the data, and green innovation falls by a third after 2016, against 29% in the data.
Firm-level evidence
If green innovation were aligned with cost-of-capital pressure, the brown firms facing the highest policy premium would innovate the most. To test this, I give each firm the premium it faces, component by component, and relate it to the green patents it files in that year and the next 2. A firm’s policy premium is the estimated price of policy risk times its emission intensity relative to its industry. The sample is 1,393 firm-years of 334 brown firms over 2008 to 2021.
Brown firms that face a higher policy premium file fewer green patents, not more. For the average firm, a premium one standard deviation (10.2 basis points) higher goes with about 10% fewer green patent applications relative to assets in the same year, and a similar, less precisely estimated drop the next. Two years out, the estimate is similar in size but not statistically significant. The diversification and hedging premia show no significant relation to green patenting.
Featured research
This blog post is based on the working paper “What drives the greenium, and does it align with green innovations?” authored by Nam Nguyen, University of Cambridge.
Article references
Eskildsen, M., Ibert, M., Jensen, T.I. and Pedersen, L.H. (2024) “In search of the true greenium.” Wharton Research Data Services (WRDS) Research Paper Series (DOI: 10.2139 ssrn.4744608)
Related articles

Research centre news
Monetary policy’s hidden conduit: who gets your deposits?
Trillions of dollars sit in bank deposits. Banks compete for savers' money, but not all banks can put it to equally good use. This article explains why healthy competition steers deposits to the banks that can do the most with it, and how monetary policy can throw sand in the wheels.

Research centre news
CERF at 25: milestone is celebrated at Cambridge Judge
The 25th anniversary of the Cambridge Endowment for Research in Finance (CERF) was celebrated at a 2-day conference at Cambridge Judge Business School that highlighted the research and scholars that CERF has supported over the last quarter-century. Founding benefactors William and Weslie Janeway were among the distinguished guests, who also included Professor Deborah Prentice, Vice-Chancellor of the University of Cambridge, and Professor Gishan Dissanaike, Dean of Cambridge Judge.

Research centre news
How monetary policy affects firm investment
Central bank decisions do more than change interest rates: they also shape how firms see the future. This article explains how this matters for the transmission of monetary policy to firm investment.