


A trillion-dollar sorting problem

The banking sector holds trillions of dollars in deposits. In the United States alone, the figure is in the ballpark of US$20 trillion. These funds matter for the real economy as banks lend them out to firms and consumers, financing the investment and spending that drive growth.
Yet banks differ widely in their investment opportunities, and in how willing they are to put this money to work, independent of their size or type. Consider, for example, 3 US banks. JPMorgan – the largest bank in the United States by a wide margin – earns 3.83% on the next dollar it lends, with 34% of its assets in loans and 60% of its deposits lent back out. UMB Financial, a regional bank a fraction of JPMorgan’s size, lends out the very same 60% of its deposits – yet earns 4.3% on the margin. Ally Bank, a smaller, digital-only lender, goes further still: it earns 5.2% on its marginal loan, with 95% of deposits lent out.
The size of the deposit market, and the varying appetite banks show for putting deposits to work, raise an obvious question: how would an efficient market allocate deposits across them? Recent research by CERF Fellow Simone Lenzu (Cambridge Judge and Federal Reserve Bank of New York) and research collaborators Fulvia Fringuellotti (Federal Reserve Bank of New York), Quinn Maingi (USC Marshall), and April Meehl (Villanova University) takes this question to the data.
Allocative efficiency in deposit markets
If deposits were allocated efficiently, banks with better investment opportunities would attract a larger share of them. As in any efficient market, prices (ie the rates paid by banks to depositors) would do the work: banks willing and able to pay more for deposits bid up their rates, and savers respond by banking with them rather than a rival paying less.
Does this happen? Using administrative data on the US banking sector between 2001-2025, the researchers find that savings are, on average, channelled toward the banks that can make the best use of them – but barely so. That is, banks with better investment opportunities do attract more deposits, by offering higher rates, but only a little higher. They also document large fluctuations of allocative efficiency and link these fluctuations to the monetary policy cycle, improving when policy is tight and deteriorating when it is loose.
Measuring banks’ marginal investment opportunities
The authors construct a bank-level measure of marginal investment opportunities (MIO): the measure is proportional to a bank’s investment income – interest income, net of loan-loss provisions, plus securities gains, excluding trading revenue – divided by its assets. The measure is a sufficient statistic for the slope of a bank’s income function at its current scale, capturing how much extra income it earns on one more dollar of assets. This is the number behind the JPMorgan, UMB and Ally figures above.
A bank’s own realised return is the right place to start, because deposits are allocated through the rate a bank chooses to offer, and a bank sets that rate against what it itself expects to earn on the next dollar – not against what society would earn from it. Thus, if deposits are allocated efficiently, they should track exactly this number.
A weak link between investment opportunities and deposit funding
Given MIO, the authors analyse whether banks with better investment opportunities pay more for deposits and get more of them. They find that price and quantity both move the right way – the signature of good competition and allocative efficiency – but the association is weak. On average, a bank with an MIO one percentage point higher than a rival’s (roughly the gap between JPMorgan and Ally Bank) offers a deposit rate that is only about 6 basis points higher and goes on to attract only about 4.5% more deposits.
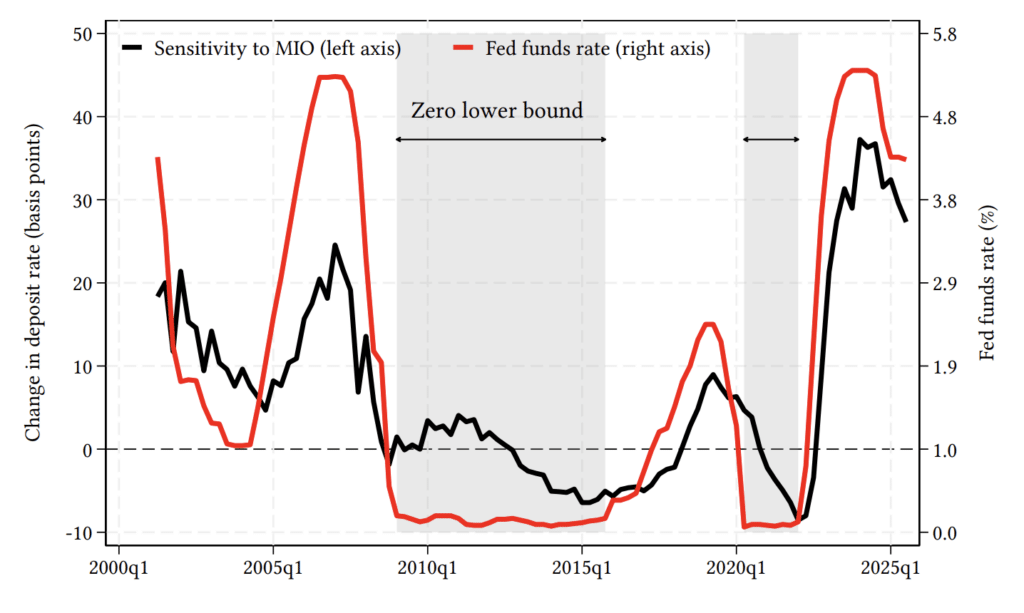
Monetary policy is the single most important predictor of allocative efficiency. The time series points to what may be the single most important force driving allocative efficiency. Exhibit 1 shows that the average masks wide variation: the degree of allocative efficiency fluctuates widely over the sample, with periods of high efficiency alternating with periods of low or severe inefficiency (blue line). Strikingly, the level of the Fed funds rate – the monetary policy rate in the US – appears to be the single most important predictor of allocative efficiency.
When the Fed funds rate is above 5%, a one-point gap in investment opportunities between 2 banks is associated with about 40 basis points higher deposit rate for the bank with the higher MIO. At the zero lower bound (ZLB) – the point at which the nominal policy rate is pushed down near zero and cannot easily go lower – the two banks, by contrast, offer essentially the same rate; if anything, the bank with the lower investment opportunities pays slightly more.
Why healthy competition stops at the zero lower bound: start from how a bank sets its deposit rate. It uses its market power to pay savers less than what their money is worth to it on the margin – its MIO – keeping the difference as the markdown, once it covers the cost of running the deposit franchise:
deposit rate = MIO – markdown – cost of running the deposit franchise
The Fed funds rate is what banks charge each other on overnight loans, so it is about as close to a risk-free return as exists in the economy. Loan and securities yields are priced off that benchmark plus a spread for credit and duration risk. So when the Fed funds rate moves, those yields move with it – and so does MIO, the return a bank earns on its next dollar. This relation between MIO and the Fed funds rate is why monetary policy – which sets the Fed funds rate – matters for deposit pricing: high policy rates leave banks with room to exercise their market power over their deposit base, allowing them to earn higher markdowns.
What happens as the Fed funds rate approaches the ZLB? To fix ideas, suppose the Fed funds rate is 5%: a bank with good investment opportunities might offer savers 4%, a bank with poor ones just 2% – a gap that tracks the underlying difference in MIO. Now lower the Fed funds rate toward zero. If the banks’ markdowns did not move, we could subtract roughly 5 percentage points from both banks’ rates. Then, the good bank would want to offer -1%, the bad bank -3%. However, depositors will not accept a negative nominal rate when cash is a free alternative. The floor caps the markdown banks can charge, pinning deposit rates near zero no matter how wide a bank’s MIO.
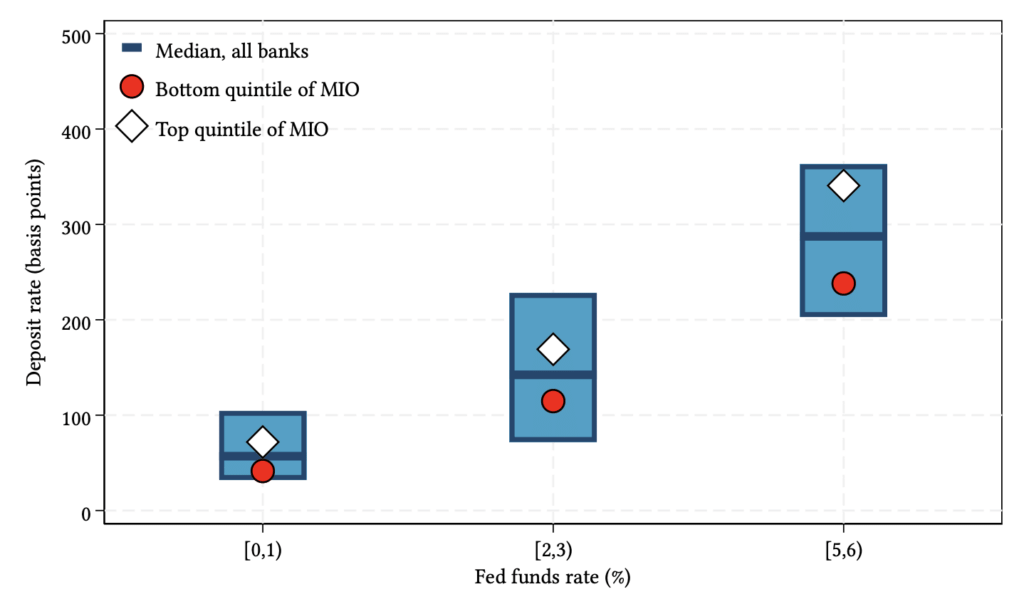
Exhibit 2 shows this in the data. Near the zero lower bound the non-negativity constraint binds and the whole distribution of offered rates collapses towards zero. The gap between banks with the best and the worst investment opportunities narrows with it, from 103 basis points to 31. This constraint, not a change in banks’ market power or investment opportunities, reduces the room for healthy competition and therefore the allocative efficiency of deposit markets.
Risk shifting at the zero lower bound
Shutting down price competition does not just mute the signal healthy competition needs; it invites a pernicious form of competition that runs in reverse. A bank at risk of distress has an incentive to bid aggressively for deposits, paying up for funding it cannot profitably deploy – a gamble for resurrection: fresh funding today, however expensive, buys a chance of surviving tomorrow.
The authors show that the gap between the deposit rate offered by economically healthy banks (those with an MIO in the top quintile) and the rate offered by banks that go on to fail within the next 8 quarters rises monotonically with the Fed funds rate. The spread between the deposit rate of healthy and failing banks is negative at the zero lower bound and strongly positive once the rate is high (Exhibit 3). Monetary policy, in other words, does not just compress deposit rates at the zero lower bound – it flips what a high rate means, from a mark of good investment opportunity to a mark of distress.
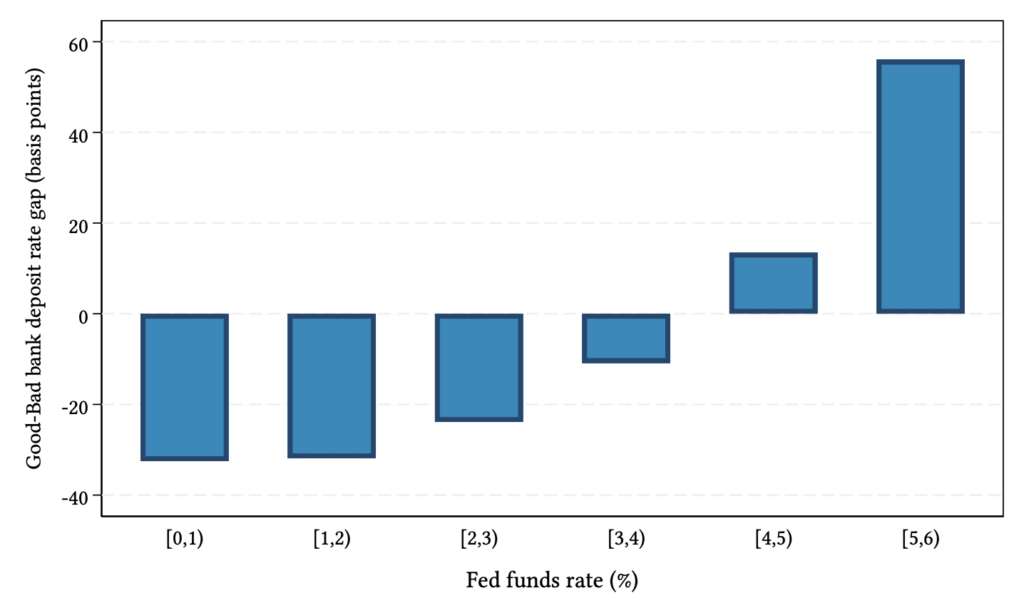
At the zero lower bound, the authors also show, a high deposit rate is a strong predictor of a bank’s future failure – and the relationship is strongest among banks with low MIO, precisely those whose high rates cannot be justified by genuine investment opportunities. Away from the zero lower bound, a high deposit rate is, in general, no longer a meaningful predictor of failure.
What this means for bank supervision and monetary policy
If risk shifting takes over precisely when rates hit zero, whatever keeps it in check the rest of the time deserves a closer look. One candidate is banking supervision. Not by chance, in the US and elsewhere, bank examiners watch for this risk-shifting behaviour and lean on banks offering high deposit rates while showing signs of distress. At the zero lower bound, though, deposit rates are compressed and ‘bad competition’ is much harder to detect.
The authors’ analysis also has direct implications for monetary policy and financial stability during extended loose policy cycles, such as 2009-2015 and 2020-2022. The price-based signal that would otherwise sort deposits toward the banks that can use them best goes dark exactly when the central bank has the least conventional room left to stimulate the economy. This is not to say that high rates are safe and low rates are dangerous. Rather, it highlights that a reduction in allocative efficiency in deposit markets works against the stimulus that accommodative monetary policy is meant to provide to the real economy.
Related articles

Research centre news
CERF at 25: milestone is celebrated at Cambridge Judge
The 25th anniversary of the Cambridge Endowment for Research in Finance (CERF) was celebrated at a 2-day conference at Cambridge Judge Business School that highlighted the research and scholars that CERF has supported over the last quarter-century. Founding benefactors William and Weslie Janeway were among the distinguished guests, who also included Professor Deborah Prentice, Vice-Chancellor of the University of Cambridge, and Professor Gishan Dissanaike, Dean of Cambridge Judge.

Research centre news
How monetary policy affects firm investment
Central bank decisions do more than change interest rates: they also shape how firms see the future. This article explains how this matters for the transmission of monetary policy to firm investment.

Research centre news
Why money helps strangers co-operate at scale
Edoardo Gallo and co-authors Maria Bigoni and Gabriele Camera investigate how co-operation can be sustained among strangers in networks of different sizes. Their laboratory experiment compares permanent ostracism, temporary ‘time-outs’, and intrinsically worthless tokens that participants can exchange for help. Temporary exclusion and monetary exchange work similarly well in small networks. In large networks, however, tokens are the only institution that produces near-full co-operation while keeping the network intact. The results show why money can be more than a means of payment: it can be a scalable institution for co-operation.