
The Cambridge Centre for Alternative Finance (CCAF), an academic research centre at Cambridge Judge Business School releases the second edition of the Global Cryptoasset Benchmarking Study.
The new findings reflect the growing maturity – and recent cooling off – of an industry that experienced huge growth in 2017. The aggregate market capitalisation of cryptoassets skyrocketed from $30 billion in April 2017 to more than $800 billion at its peak in early January 2018, until coming down again to hover at around $200 billion.
The annual survey by the CCAF provides a systematic empirical analysis of the rapidly evolving cryptoasset ecosystem, illustrating the structure of a dynamic industry composed of four key segments (mining, storage, exchange, and payments) that collectively grew more than 160 per cent in 2017. The analysis is based on non-publicly available data from more than 180 startups, established companies, and individuals covering 47 countries across all world regions.
Key highlights of the findings include:
- Millions of new users have entered the ecosystem, but most remain passive.
Total user accounts at service providers now exceed 139 million with at least 35 million identity-verified users, the latter growing nearly four times in 2017 and doubling again in the first three quarters of 2018. Only 38 per cent of all users can be considered active, although definitions and criteria of activity levels vary significantly across service providers.
- Firms are increasingly operating across segments.
The cross-segment expansion observed in 2017 has continued. 57 per cent of cryptoasset service providers are now operating across at least two market segments to provide integrated services for their customers, compared to 31 per cent in early 2017.
- Multi-coin support is rapidly expanding.
Multi-coin support has nearly doubled from 47 per cent of all service providers in 2017 to 84 per cent in 2018. This is a trend primarily driven by the emergence of common standards on some cryptoasset platforms (e.g. ERC-20 on Ethereum) that has resulted in a rapid increase in the supply of tokens.
- The majority of identified mining facilities use some share of renewable energy sources as part of their energy mix.
The study estimates that as of mid-November 2018, the top six proof-of-work cryptoassets collectively consume between 52 and 111 terawatt-hours (TWh) of electricity per year. The mid-point of the estimate (82 TWh) is the equivalent of the total energy consumed by the entire country of Belgium – but also constitutes less than 0.01 per cent of the world’s global energy production per year. A notable share of the energy consumed by these facilities is supplied by renewable energy sources in regions with excess capacity.
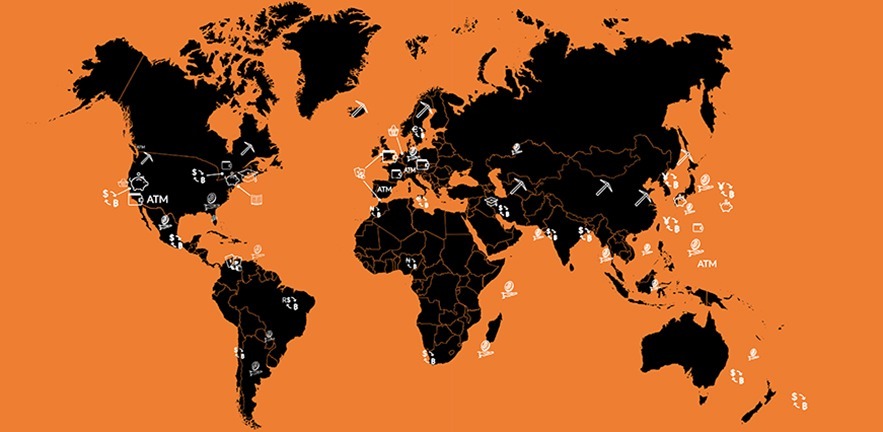
- Mining is less concentrated than commonly perceived.
Cryptoasset mining appears to be less concentrated geographically, in hashing power ownership, and in manufacturer options than commonly depicted. The mining map exhibits that hashing facilities and pool operators are distributed globally, with growing operations in the USA and Canada.
- Self-regulatory efforts reflect growing industry maturity.
Industry actors are pro-actively adopting measures that appear to comply with existing regulation despite not necessarily being explicitly subject to regulations. The increasing number of self-regulatory initiatives, combined with the emergence of sophisticated and professional services, reflect the growing maturity of the industry.