

By Alexander Neumueller, Research Lead – Climate Aspects, Cambridge Digital Assets Programme, Cambridge Centre for Alternative Finance
A review of our work to date
Bitcoin’s popularity has surged in recent years, largely shedding its negative image and gaining mainstream acceptance. However, with this increase in popularity came scrutiny. The fast growth of Bitcoin mining has raised concerns about the industry’s energy-intensive nature and associated environmental and social externalities. In the debates surrounding regulatory interventions, some claim that Bitcoin jeopardises environmental advancements and could exacerbate climate change, while others argue that it could help combat climate change and provide other societal benefits. However, the intricate nature of the industry and the lack of information are often under-recognised, making room for cherry-picked data points and biased perspectives. Therefore, acknowledging the complexity and nuance-rich nature of this topic is paramount.
We launched the Cambridge Bitcoin Electricity Consumption Index (CBECI) in response to this growing demand for reliable data-driven insights in July 2019. Reflecting the increasing public interest in the topic, our work has evolved, gradually expanding the Index’s scope to provide the building blocks necessary to form a more complete picture of Bitcoin’s environmental footprint.
The first version of the Index was based on a techno-economic model giving insights into the electricity use of global Bitcoin mining activities. Gradually, we incorporated supplementary features such as historical power demand and cumulative electricity consumption. Nonetheless, while electricity consumption is crucial to understanding Bitcoin’s environmental footprint, it is only one element. To develop a more complete understanding, we needed to determine how the electricity consumed is generated and hence required information about the geographic distribution of Bitcoin mining.
To address this knowledge gap, we updated the Index in May 2020 by integrating a new tool, the Mining Map, which provides unique insights into the geographical distribution of the hashrate (the computational power provided to the network) over time. This then became the cornerstone of our approach to estimating greenhouse gas (GHG) emissions attributable to Bitcoin (launched in September 2022), where we leveraged information from our previous studies to provide a fuller picture of Bitcoin’s climate impact than only considering electricity consumption would allow us to.
The update introduced in this article represents a major revision of our original method to estimate Bitcoin’s electricity consumption. After evaluating feedback from various stakeholders, we decided to comprehensively review our existing methodology to determine whether it needed improving and, if so, devise and test an update that could help address identified issues.
To give context to the reasoning we present in the coming sections, we first introduce Bitcoin mining and its evolution. We pay special attention to the technological advancement of dedicated mining hardware, colloquially called ASIC (application-specific integrated circuit) miners, and how trends in advancement have changed. Next, we explore an array of data, from US import records of Bitcoin mining hardware to industry statistics, and compare it with our previous and updated estimates. To conclude, we summarise the rationale behind the implemented modifications and, by applying them retroactively, detail how they have influenced our historical estimates.
A review of the technical evolution of Bitcoin mining hardware
The birth of Bitcoin in 2009 ignited a technological revolution that transformed the realm of digital assets and transactions. This pioneering cryptocurrency, introduced by the pseudonymous Satoshi Nakamoto, is underpinned by a process called ‘mining’ – the backbone of its decentralised network. Mining refers to the computational process of introducing new Bitcoins into the circulating supply and adding transactions to the blockchain. The process is based on the proof-of-work (PoW) consensus algorithm, where miners must solve a cryptographic puzzle requiring significant computational resources and energy. Miners compete to solve these puzzles, and the winner is given the opportunity to add a new block to the blockchain. The miner’s proposed block includes a list of valid transactions, and once added to the blockchain, these transactions become practically unalterable, resulting in a transparent and immutable record. For their efforts, miners are rewarded with a certain number of newly minted bitcoins (called the block subsidy, which halves approximately every 4 years) and transaction fees from the transactions in their block. As Bitcoin’s value and popularity grew, mining became increasingly competitive, sparking a remarkable mining hardware evolution.
The early stages of Bitcoin mining: a journey from CPUs to FPGAs
In Bitcoin’s early days, mining was a rudimentary process using standard personal computers to mine blocks, a testament to the modest computational demands of the network at that time. This era was characterised by leveraging central processing units (CPUs). CPUs, designed to handle a wide range of tasks, were adequate for the early computational demands of Bitcoin mining. However, as Bitcoin’s value increased, the network expanded and competition for block rewards intensified, creating a demand for more sophisticated and efficient hardware. This catalysed a transformation in mining hardware. By October 2010, graphics processing units (GPUs), originally engineered for gaming applications, were co-opted for mining. GPUs, capable of performing simple mathematical operations in parallel, were approximately 6 times more efficient at mining than CPUs. However, this leap in efficiency increase was short-lived and was soon overtaken by field programmable gate arrays (FPGAs) in 2011. FPGAs, while more labour-intensive to construct, were significantly faster than top-tier GPUs due to their hardware and software configuration flexibility, making them well-suited for Bitcoin mining.
Modern-day Bitcoin mining: the rise of ASICs
The relentless pursuit of greater performance and efficiency culminated in a third phase in mining hardware evolution: application-specific integrated circuits (ASICs). The first generation of ASICs was announced in 2012,[1] and the first deliveries – sometimes more, sometimes less successful – were made by a few manufacturers in 2013.[2] From then on, ASICs quickly conquered the mining industry, establishing themselves as the devices of choice due to their superior efficiency compared to previous technologies. It was then that the first criticisms were raised, accurately predicting that the advent of ASICs would herald a shift from at-home mining to concentrated mining activities at professional data centres.[3]
Unlike their predecessors, ASICs are designed to execute specific operations, resulting in unparalleled efficiency, albeit at the expense of their versatility. The most important technological development since the inception of ASICs has been the progressive reduction in chip size, decreasing from 130 nm (nanometer) in 2013[4] to 5 nm in recent models.[5] This has significantly enhanced mining efficiency; the smaller the chip, the less electrical power is needed to transmit data.
However, it is becoming more evident that the pace of technological advancement has slowed and steadied. The initial frenzied leaps in computational power and efficiency gains have given way to more incremental improvements, reflecting the maturation of Bitcoin mining technology. Since 2020, the pace of efficiency improvements has noticeably decreased, and hardware manufacturers will likely find it increasingly challenging to deliver further efficiency gains. This slowdown is primarily due to the physical limits of semiconductor technology, embodied in Moore’s Law, which has driven the industry for decades. As we approach these boundaries, manufacturing smaller chips is becoming more challenging and expensive.[6]
This deceleration in technological advancement impacts the projected lifetime of mining hardware. Previously, rapid progression rendered ASIC hardware obsolete and unprofitable comparatively swiftly, justifying assumptions of a shorter economic life. However, the deceleration, as observed in Figure 1, means that older devices remain profitable for longer, thus, from a profitability perspective, affecting the anticipated lifespan of ASIC hardware, likely leading to extended device replacement cycles.
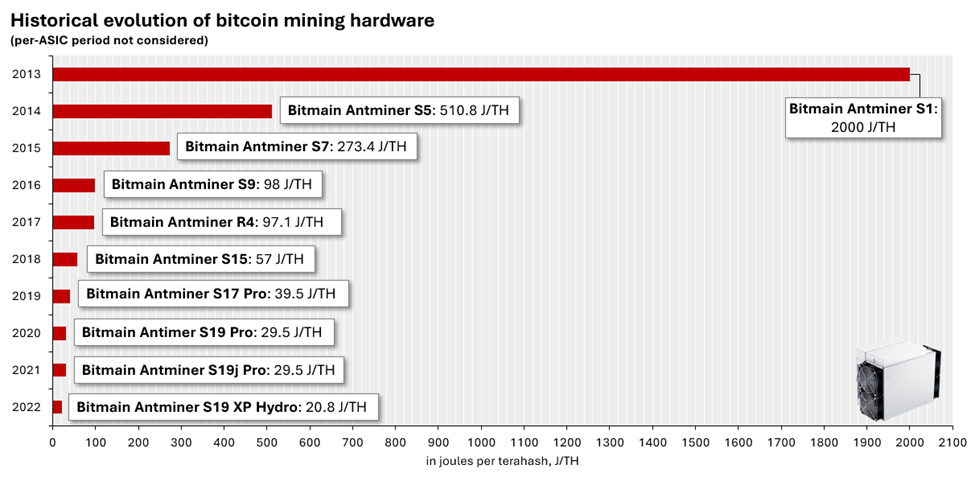
Figure 1: Historical evolution of Bitcoin mining hardware | Source: Bitmain
Overall, lifetime estimates vary considerably. While academia tends to assign shorter lifespans of around one-and-a-half years or less,[7] [8] industry estimates are significantly longer – usually 3 to 5 years and even longer for immersion or liquid-cooled equipment.[9] The longevity of hardware is influenced by numerous factors, ranging from operational parameters such as maintenance, environmental conditions and machine over- or underclocking (which can either shorten or lengthen the lifespan) to profitability factors, which oscillate with Bitcoin’s price and mining difficulty.[10] Elevated Bitcoin prices may bring less efficient, older ASIC models back into operation, while decreased prices or heightened mining difficulty can have the opposite effect.
Historical development of hashrate
As previously discussed, there has been remarkable progress in mining hardware development over time. This has led to a tremendous increase in the computing power contributed to the network, measured in the number of hashes performed every second. In this section, we explore how the network hashrate, often regarded as the level of network security,[11] has evolved. The evolution illustrates the significant impact that advances in mining hardware have had on the network.
The introduction of newer hardware models has led to equipment that is not only markedly more efficient than its predecessors but also substantially more powerful. (It should be noted that Figure 1 only represents device efficiency (measured in terms of J/TH) and does not address computing power.) For instance, the 2016 flagship model of Bitmain, the Antminer S9, had a hashrate of 11.5 TH/s. In contrast, the 2022 flagship model, the Antminer S19 XP, delivered 140 TH/s. Even more powerful models launched that year, like the Bitmain Antminer S19 XP Hydro, achieved 260 TH/s. Recently, MicroBT announced the Whatsminer M53S++, delivering a staggering 320 TH/s.[12] The augmented computing power of each subsequent generation of mining hardware is particularly relevant later in this article, as it significantly influenced our decision to refine the methodology behind our electricity consumption estimates.
Figure 2 shows the development of the average daily Bitcoin network hashrate from our initial data point in January 2009 to August 2023. Particularly noteworthy are the substantial increases during the pre-ASIC and early ASIC eras. The steep rise from 2009 to 2011 can largely be ascribed to a low inception point (initially, the network comprised only a few personal computers) and the growing interest that prompted the network to progress from using CPUs toward GPUs and FPGAs. However, the dramatic surge in hashrate after the introduction and subsequent proliferation of ASICs is equally striking. This trend underscores the evolving paradigm in Bitcoin mining, transitioning from conventional at-home devices to dedicated mining hardware. In this context, a salient concept is that an increase in hashrate makes mining Bitcoin more difficult, compelling miners to contribute more computational power to maintain the same reward level. This directly influences the profitability of mining operations.
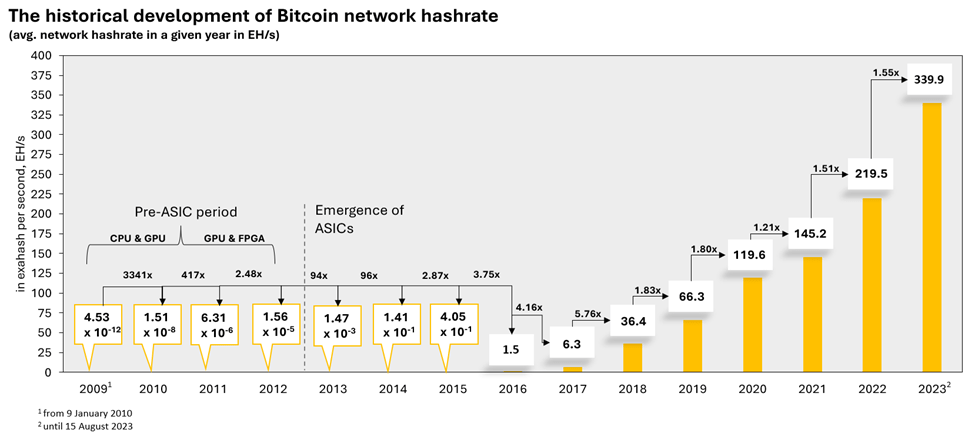
Figure 2: Development of Bitcoin network hashrate over time | Source: CoinMetrics
Staying ahead: responding to the technology paradigm shift
Guided by the principle of ‘keep up with times and time won’t pass you by’, we have undertaken a comprehensive review of our existing methodology. The review focused on recent developments in Bitcoin mining hardware and hashrate, evaluating whether our current approach still accurately reflects the status quo. One particularly pertinent question is what has driven the substantial increases in hashrate observed over recent years (Figure 2), especially as newer models have eclipsed their predecessors in computing power. We have carefully examined how our methodology reflected these developments and introduced an update incorporating improvements based on our findings. Before delving into these matters, we have provided a concise overview of our previous methodology and estimates below.
Since 2019, the CBECI has been providing 3 electricity consumption estimates: a hypothetical best-case and a hypothetical worst-case scenario, between which lies our most reliable estimate. Each estimate on our website is premised on the core assumption that miners, as rational economic actors, will avoid operating unprofitable hardware. The distinction among these estimates is in the assumed hardware composition – in other words, what devices Bitcoin miners use. In this article, we focus on our previous base case, where all hardware models considered were assumed to contribute an equal amount of hashrate. Visit our website for detailed information about how we selected hardware models in our previous approach, along with other assumptions.
Acknowledging a changing technological landscape
While literature often advocates for bottom-up approaches where possible, the decentralised nature of the network makes it challenging to collect data. In this case, our hybrid top-down methodology has earned commendation as a practical alternative when gathering bottom-level data is unfeasible.[13] As more information becomes available, we understand that our methodology should evolve accordingly and maintain an equilibrium between precision and consistency. Consequently, we exercise caution when altering our methodology, rigorously examining any changes.
Our previous methodology has proven effective during periods of low mining profitability, particularly when benchmarked against industry estimates. However, when Bitcoin mining is especially lucrative, the methodology exhibited shortcomings, which were particularly conspicuous in 2021, when mining profitability soared. The core of the matter lies in the assumption of equal weighting, the consequences of which were exacerbated after China’s ban on cryptocurrency mining, which further led to a shortage of hosting space for hardware. Evidence suggests this bottleneck resulted in even next-generation hardware being stored in warehouses due to a lack of space in data centres.[14] [15] Given that even new machines were being stored, it is reasonable to infer that mining operators would have already replaced all old machines with newer models, exploiting all possible means to enhance the overall efficiency of their mining operations.[16]
As we explore later, this raises critical questions about what hardware drives hashrate to what extent. As Figure 2 demonstrates, the Bitcoin network hashrate has increased significantly over time, prompting us to examine what catalysed this growth. Analysis of ASIC hardware reveals that the devices have not only become considerably more efficient over time but also significantly more powerful. Unfortunately, the scarcity of hardware-related data poses a significant challenge as it limits our ability to accurately assess the types of hardware that miners use and the extent of their use. To address this lack of data, we created a methodology that simulates a daily hardware distribution based on performance and power usage data of real hardware. Yet, the backbone of our previous CBECI methodology was the assumption that every profitable hardware model released less than 5 years ago equally fuelled the total network hashrate. This, however, led to a disproportionally large number of older devices compared to newer ones in our assumed hardware distribution during exceptionally profitable mining periods.
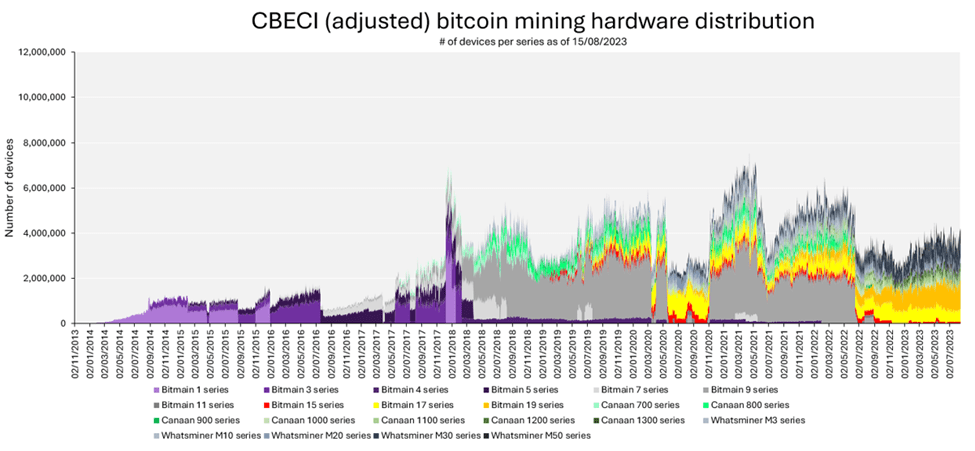
This can be seen in Appendix 1, which shows the number of operational devices our previous CBECI model has allocated to each mining hardware series from the 3 major manufacturers: Bitmain, MicroBT and Canaan. For instance, in December 2017 a sudden surge in mining profitability resulted in the Bitmain Antminer S1 and S3 series (released in 2013 and 2014, respectively) constituting most of the devices.
Given the impact the absence of significant technological advancements had on our methodology, we decided to thoroughly re-examine the ASIC mining hardware distribution generated by our previous CBECI model and cross-check the results against other metrics from publicly available data. We found that more recently released equipment appeared to be underrepresented, and equipment nearing the end of its lifecycle was overrepresented. It was this imbalance that prompted us to update our methodology. The findings we now present provide the rationale behind this decision. For more information on how the methodology update affected the assumed distribution of mining hardware, see Appendix 2.
Investigating the drivers of hashrate growth
This section outlines our investigation into the relationship between increases in network hashrate and the potential factors that could have catalysed this growth. We begin by comparing the development of hashrate with recent Bitcoin mining hardware deliveries, using US import data on such equipment as a proxy,[17] followed by an examination of publicly available sales data of Canaan Creative, one of the 3 major manufacturers of Bitcoin mining hardware.[18]
We first determined the extent to which equipment imports to the US correlate with hashrate increases. An underlying presumption is that these imports primarily comprise newer ASICs rather than older models, evidenced by known purchases of publicly listed or larger-scale private miners[19] and Canaan’s sales data. According to Canaan’s latest Form 20-F filing,[20] the company’s Avalon A12 flagship generation, along with sales of the Avalon A13 series, accounted for 99.2% of the company’s overall hashrate sales in 2021 and all sales in 2022. This corroborates our assumption that the imported equipment predominantly comprises newer models.
Let us delve deeper into the data on cryptocurrency mining equipment imports to the US, as illustrated in Figure 3(a). The bars represent the equipment weight in metric tons, and the line shows the development of the network hashrate (in EH/s) from March 2022 to March 2023. In this context, it is crucial to note that the hashrate is a lagging indicator. According to industry experts we consulted, there may be a considerable interval between when import data is recorded and when ASICs are installed and operational. We will expand on this point in a later section.
Our objective in this analysis is to convert the data obtained from the import records into a hashrate, and then extrapolate this US-specific data to the global Bitcoin mining industry. To this end, we formulated a metric, terahash per second per kilogram ((TH/s)/kg), drawing on Canaan’s Avalon A12 and A13 series. We then combined this metric with the US import data on Bitcoin mining equipment and the country’s latest hashrate share,[21] which allows us to approximate the overall impact of newer mining equipment on the total network hashrate. The outcome of this approach is depicted in Figure 3(b).
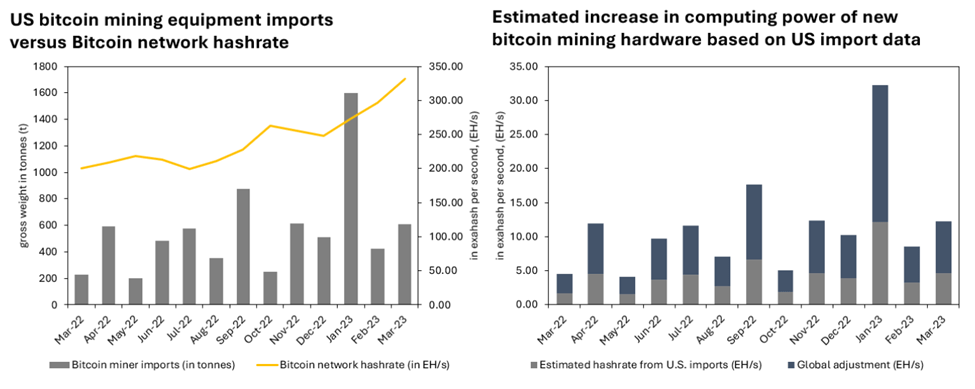
Figure 3: (a) US import records on Bitcoin mining equipment and (b) estimated computing power derived from import data. We used the hashrate (in TH/s) and gross weight stated by the manufacturer and applied an equally weighted mix of the following models: Avalon A1246, Avalon A1266, Avalon A1346 and Avalon A1366. | Sources: TheMinerMag, US import records, CoinMetrics, Canaan and own calculations
The grey bars represent the approximate hashrate of US imports, and the blue bars are the estimates when extrapolating the US data to a global scale. Throughout the assessed period, the average network hashrate rose from 200.79 EH/s to 331.55 EH/s, an increase of 130.76 EH/s. Meanwhile, the estimated hashrate increase, based on US import data, implies that about 55.76 EH/s were rendered available by new imports in the US. This would equate to 147.35 EH/s if projected globally, a figure that closely resembles the observed development of the network hashrate during the same period. However, it is worth repeating that the imports in the last few months of the observed period may not have been reflected in March’s network hashrate.
Although this approach is a rough approximation and subject to numerous simplifications and assumptions, the findings reinforce a plausible link between rising network hashrate and the delivery and installation of more recent hardware. To supplement the analysis above, we cross-verified our findings with ASIC sales data from Canaan Creative’s annual reports to determine whether the conclusion drawn is supported by additional evidence. Furthermore, we show how our adjusted CBECI model compares with both, its predecessor and the industry data. We briefly introduce the updated methodology at the end of this segment.
Our comparison primarily focused on 2021 (see Figure 5) due to the relatively high mining profitability that year (see Figure 4) and the resulting decrease in average miner efficiency, contrary to historical trends (see Figure 7(b)). A similar analysis was also conducted for 2022 (see Appendix 3). However, the low profitability during this period rendered a large portion of the hardware unprofitable, leading to outcomes that are less straightforward to compare. For instance, in 2022, almost all of Canaan’s hardware over 2 years old was not profitable under our default electricity cost assumption of USD0.05/kWh. Accordingly, in Appendix 3, we added the mining hardware distribution for 2 scenarios: one considering all of Canaan’s hardware less than 5 years old and the other using the same assumptions as in our estimates.
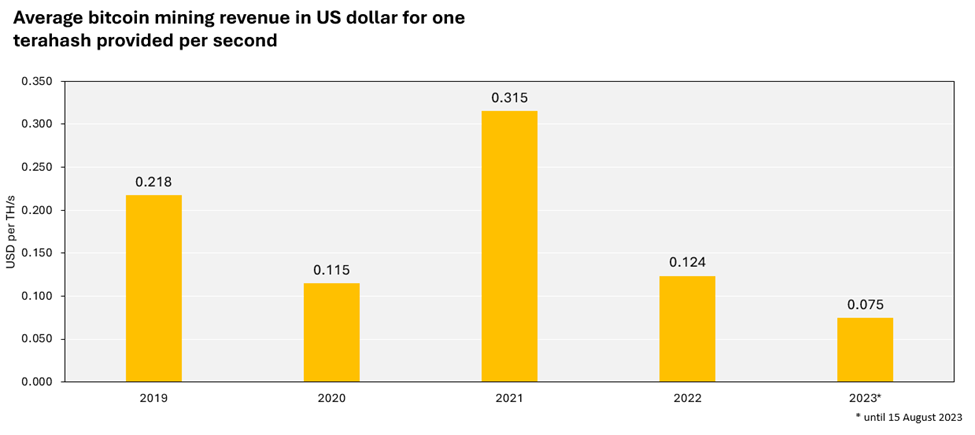
Figure 4: Bitcoin mining revenue per unit of computing power provided per second. The revenue consists of block subsidies, ie, newly minted Bitcoins and transaction fees. | Source: CoinMetrics
Before proceeding with our analysis, it is crucial to consider an important caveat. Canaan’s hashrate sales figures only provide a small glimpse of the broader picture, given that they represent just a fraction (between approximately 16.8%[22] and 18.0%[23]) of total ASIC sales worldwide. Therefore, the subsequent analysis is influenced by the specific characteristics of Canaan’s sales data. The sales figures show marked discrepancies between different product series. For instance, the A8 series, launched in 2018, registered robust sales during its release year and maintained strong sales the following year. In contrast, the A11 series, introduced in 2020, reported a significantly smaller sales volume, with its predecessor, the A10 series, retaining its high sales volume in 2020. These variations in the sales performance of different series could skew the ensuing analysis. A more comprehensive analysis, however, would require sales data from other manufacturers to determine whether these sales fluctuations between series are Canaan-specific idiosyncrasies or reflect a broader industry trend.
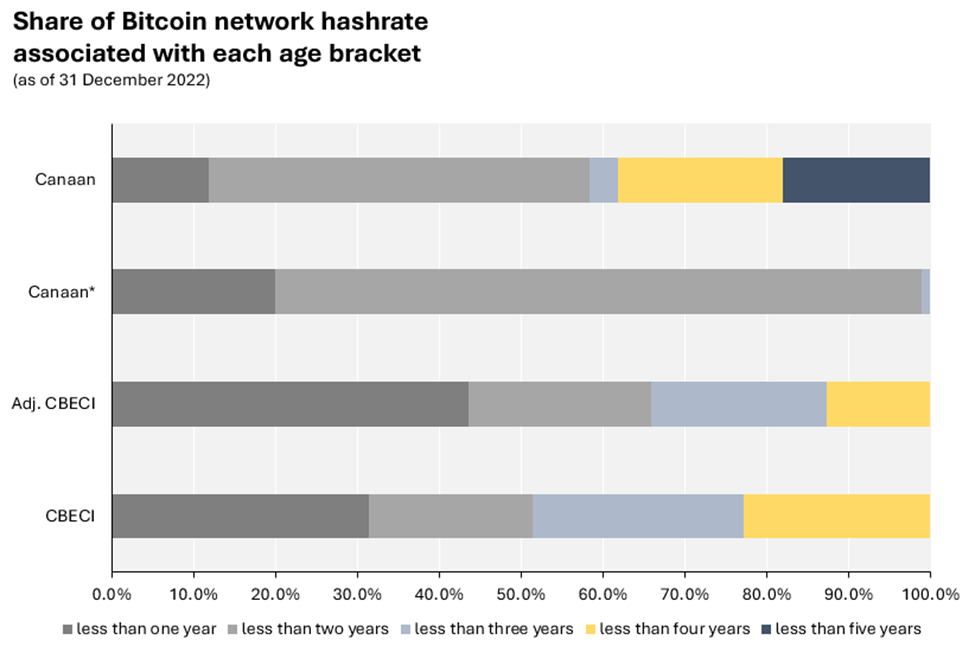
Figure 5 offers insights into the proportion of the network hashrate attributable to ASICs, categorised by their release dates across 5 distinct ‘release windows’. Here, ‘release window’ refers to hardware devices whose release date falls within one of the designated intervals. For example, in the snapshot taken on 31 December 2021, an ASIC model launched in July 2020 would fall into the category of ‘at least one but less than 2 years’ old.
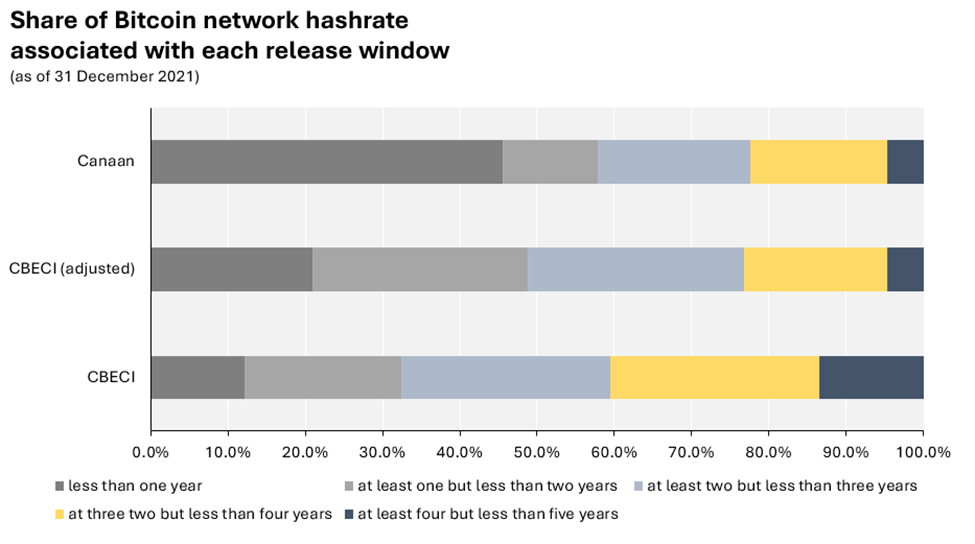
Figure 5: Distribution of Bitcoin mining hardware based on release year. The release date of all ASIC models in the annual report for each series was checked. Each series was classified into one of the 5 categories based on the year of release. Typically, all models of a series were released in one year, but occasionally, new models of an existing series were announced the following year (this applied to the following models: Avalon A852, Avalon A1066 Pro and Avalon 1266). In these cases, all hardware sales of that series were entirely attributed to the latest model. | Sources: Canaan, CCAF
As Figure 5 shows, there is a sizeable discrepancy between all 3 estimates in the hashrate associated with devices released in 2021, ie, those considered less than one year old. The previous CBECI model estimated that approximately 12.1% of the network hashrate was associated with mining hardware less than one year old. This is in stark contrast to Canaan’s data, which shows that their most recent release for that year (the Canaan Avalon A1246) accounted for around 44.8% of their total hashrate sold from 2017 to 2021. Our adjusted CBECI model puts this figure at 20.9%, also markedly lower than Canaan’s sales records indicate. However, several nuances warrant consideration. The data from Canaan’s annual reports relate to the hashrate sold, which may not necessarily align with the hashrate that was already operational that year. This difference could potentially overstate the proportion of newly released hardware. Yet, a press release by Canaan suggests that deliveries of its A12 series began early in the year (Q1),[24] implying a greater likelihood that a larger quantity was operational.
The time lag between sales recorded and operation is difficult to determine and depends heavily on the buyer’s location and mode of transport.[25] [26] Estimated delivery times vary widely, ranging from one week [27] to one or more months.[28] [29] However, a longer duration seems more plausible in light of China’s ban on cryptocurrency mining in 2021 and the probable ensuing surge in long-haul transportation. We have incorporated this aspect into our revised model. Previously, we presumed that ASICs would become immediately available once released, while in practice, there is a delay between manufacturer dispatch and installation in the mining farm. Therefore, in our revised CBECI model, we decided to incorporate a 2-month time lag to account for delivery and installation.
Upon analysing the share of hashrate associated with at ‘least one but less than 2 years’ old devices, the relatively low proportion of these devices represented in Canaan’s sales (12.40%) becomes apparent when compared to our adjusted (27.6%) and previous (20.3%) CBECI models. As alluded to earlier, the A11 series (released in 2020) saw markedly lower sales volumes than other models in their A series, with most of 2020’s sales comprising its predecessor, the A10 series. However, when using publicly available information to gauge, for instance, the sales success of Bitmain’s Antminer S19 series, it appears that not all manufacturers experienced low sales figures in that release window.[30] If we consider the first 2 release windows on an aggregated level, we can see that the gap between Canaan’s sales data (59.3%) and our revised (47.0%) and previous (32.2%) CBECI model noticeably narrowed.
A similar but less pronounced pattern emerged in the third release window (‘at least 2 but less than 3 years’), with 19.7% (Canaan), 28.7% (CBECI adjusted) and 27.1% (CBECI) of hashrate share being associated with that interval. Noticeably, when again considering the windows on an aggregated basis, our revised model indicates a share of devices less than 3 years old that is nearly equal to Canaan’s sales data (75.7% and 77.5%, respectively). Based on this finding, we can conclude that the hashrate proportion our revised model attributed to devices of this age range is largely consistent with industry data. Conversely, the previous CBECI model maintained a considerably lower combined share (59.3%) of these devices.
The shares from our revised CBECI model are also notably similar to industry data across the remaining 2 release windows. In contrast, our previous CBECI model portrays a markedly different picture. Here, the previous model indicates that devices within the ‘at least 3 but less than 4 years’ interval can be associated with 27.0% of network hashrate, significantly higher than the share suggested by Canaan’s sales figures (17.8%) and our revised model (18.6%). Furthermore, the ‘at least 4 but less than 5 years’ share in the previous model accounts for 13.5%, almost triple that indicated by the other estimates (both roughly 5%).
In conclusion, we conducted this analysis to test our hypothesis that increases in network hashrate can likely be attributed to more recently released mining hardware. This hypothesis was based on US import data, and we sought additional evidence to validate it. If Canaan’s sales data is representative of the industry, it corroborates this claim.
While the observed industry data might suggest that even the adjusted approach underestimates the share of next-generation devices (Figure 5), we maintain a conservative stance for several reasons. Chief among these is that the industry data examined was from only one manufacturer, potentially introducing sample bias and propagating any unique factors associated with that manufacturer. We now discuss several other limitations to consider when interpreting our results. Some might contribute to overestimating the share of recently released devices, while others may exaggerate the proportion of older devices in operation.
A notable limitation that could lead to overestimating the prevalence of recently released hardware is the unknown time gap between recording a sale and the sold device becoming operational. Consequently, sales data for a specific year does not necessarily imply that all the sold devices were operational within that year. In fact, such an assumption seems improbable as, inevitably, the equipment must be transported and then installed once it arrives at its destination, all of which takes time. A similar issue arises with import records, where there is a time lag between the equipment being listed in the records and its operation.
Another crucial factor to consider when depending on historical sales data is the assumption that all the devices sold since 2017 were operational at the end of 2021. While no consensus exists on the exact lifespan of mining hardware, not considering wear and tear likely led to the proportion of the network hashrate driven by older devices being overstated.
The findings of this analysis, even though being based on limited data and involving many assumptions and simplifications, were instrumental in our decision to adjust our previous CBECI model. In response to these findings, we integrated a weighting factor into the revised methodology and accounted for a time lag between the release of new hardware and its operation. Visit our website for more details on the updated methodology.
A new lens on the past: revisiting historical estimates
Now that we have explained the rationale behind the decision to update our methodology, we will explore the consequences of these changes when applied retroactively. As transparency is a cornerstone of our work, we will showcase how this update has altered past estimates and pinpoint specific periods where adjustments are most pronounced.
Figure 6 contrasts the annual electricity consumption estimates of both models. Before 2021, the estimates do not significantly deviate and are largely consistent. This can be attributed to the rapid technological progress made in the early years of Bitcoin mining (Figure 1). These advances rendered older hardware too inefficient to be profitable at reasonable electricity rates, leading to their exclusion in the estimates. Consequently, the previous model has proven reliable in the past. The first and most noticeable discrepancy appears in 2021, where our previous CBECI model estimated an electricity consumption of 104.0 TWh, 15.0 TWh higher than the revised model estimate (89.0 TWh).
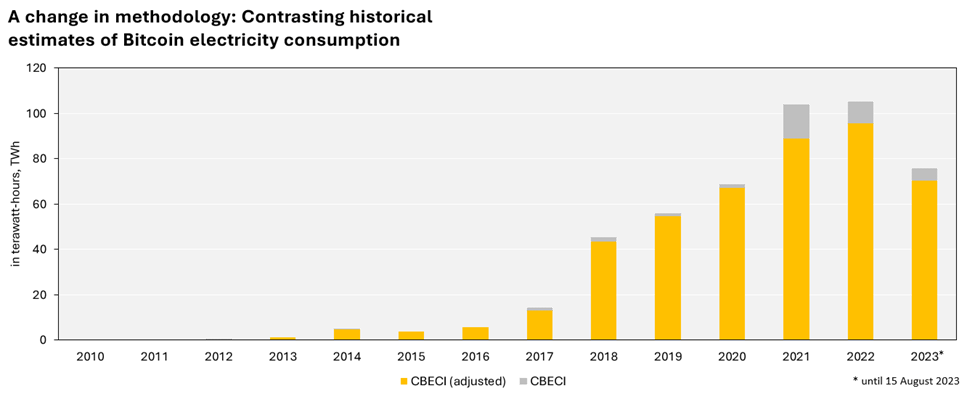
Figure 6: Comparison of annual Bitcoin electricity consumption estimates (as of 15/08/2023). The result for 2023 represents the year-to-date estimate. | Source: CCAF
There are also less pronounced but still noteworthy differences in 2022 and 2023. The 2022 estimate was adjusted downward by 9.8 TWh, from 105.3 TWh to 95.5 TWh. To put this into perspective, the revised figure is comparable to the electricity consumption of countries like Belgium (83 TWh) or the Netherlands (113 TWh), [31] the energy use of domestic tumble dryers in OECD countries, China and India ** (108 TWh), [32] and renewable curtailment in China.[33] In terms of global electricity consumption, it represented about 0.38%.[34] As for 2023, the year-to-date electricity consumption estimate has been revised from 75.7 TWh to 70.4 TWh.
The discrepancies arise from the weight adjustments of older devices, which are often borderline profitable. While those devices were equally weighted in our previous model, the revised model takes into account release dates and assigns weights to each considered mining hardware accordingly.
Figures 7(a) and (b) provide a more comprehensive understanding of our hardware efficiency estimates that underpin the electricity consumption estimates and the impact of applying the updated methodology. Figure 7(a) displays the daily efficiency estimates of the previous and revised CBECI models based on their underlying ASIC mix. Both models reveal a sudden, pronounced increase from October 2020 to February 2021. However, the upward trajectory of the previous model is substantially steeper, with the estimated efficiency declining by roughly 60% from about 50 J/TH to almost 80 J/TH, compared to a decline of approximately 40% from about 50 J/TH to nearly 70 J/TH, indicated by the revised model. In this context, efficiency refers to the amount of electricity required to perform a given amount of computational work. Hence, the higher the value, the lower the efficiency.
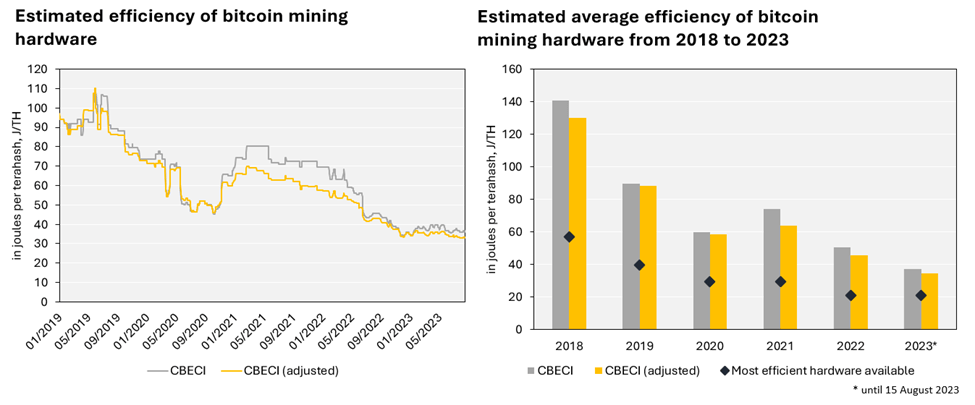
Figure 7: (a) Daily Bitcoin mining hardware efficiency estimates and (b) yearly average Bitcoin mining hardware efficiency estimates. | Source: CCAF
When comparing the estimated efficiency of both models for 2021 across the entire year (Figure 7(b)), the results reveal that the assumed mining hardware efficiency of the previous model (74.2 J/TH) is a noticeable 10.6 J/TH greater than the revised model’s estimate (63.6 J/TH). The graph also shows that the adjusted model assumes higher efficiencies (a lower J/TH value) in all observed years, albeit marginally.
Furthermore, it is also interesting to see how our estimated efficiencies compare with those of the most efficient devices released in a given year (Figure 1). Figure 7(b) clearly shows that both our estimates assume considerably less efficient hardware than the flagship devices released each year. While it is entirely plausible, and indeed quite likely, that hardware is used for many years after its release and is not immediately replaced when newer models become available, especially during times of exceptional mining profitability, it nonetheless underscores the importance of regularly revisiting existing research. Given the continuous technological advancements in this industry, it is paramount to be mindful of new information becoming available and, if justified, incorporate new insights or adjust existing parameters to ensure our estimates remain as reliable as possible.
Due to the decentralised nature of the Bitcoin network, gathering reliable data presents inherent challenges. Nevertheless, we believe that our analysis of industry data and import records provided sufficient evidence to warrant the implementation of this update. We trust that it will help mitigate some of the limitations inherent in our previous methodology and demonstrate our commitment to continually review and optimise our estimates as required.
A glance into the future
While we are confident about our estimates and regard each update as a progressive step toward enhancing their reliability, we must acknowledge that Bitcoin’s actual electricity consumption remains elusive and can only be approximated. As outlined in our methodology, numerous inherent limitations underscore the need to continually explore methods to improve data quality.
Moreover, while electricity consumption is a crucial element in determining Bitcoin’s environmental footprint, it is but one. The energy sources used in Bitcoin mining are just as important. As a starting point, data on the geographical distribution of mining activities helps us understand where and to what extent mining activity occurs. Although this provides a rudimentary picture, a host of additional factors are required for a more complete assessment. For instance, the electricity generation mix within a country can vary substantially from region to region. And even if data is available that would allow us to narrow down mining activity to specific regions within a country, there is evidence that miners are not only running in front but also behind the meter.[35]
Apart from the challenges already mentioned in determining the electricity mix, various other factors that affect Bitcoin’s environmental footprint have not yet been considered in our environmental assessment. We shall briefly examine some of these.
Emerging concepts we have yet to consider but could reasonably be expected to lower our emission estimates include the potential to mitigate methane emissions by mining operations collocating next to oil fields and utilising otherwise flared natural gas,[36] using and subsequently sealing orphaned gas wells,[37] and mitigating methane emissions from landfills,[38] but also extend to other novel concepts such as waste-heat recovery.[39] Other potential benefits that are more challenging to quantify range from mining serving as a potential catalyst for investment in renewable electricity generation infrastructure to providing increasingly important ancillary services to grid operators.[40]
Conversely, there are also negative implications that require further enquiry. One example is e-waste, currently estimated at 30 kt[41] to 60 kt,[42] which our current emissions estimate does not take into account. Other negative externalities not considered are reports about noise disturbances,[43] water use and thermal pollution.[44]
Overall, it is evident that much work is yet to be done to enhance our understanding of the broader implications of this nascent industry on the environment and society. As we progress, a key priority of our research will be to develop a more nuanced perspective of Bitcoin’s electricity mix and more closely examine the climate risks and opportunities associated with cryptocurrency mining. Work on a publicly accessible carbon accounting tool for Bitcoin is also well underway, enabling users to quickly approximate emissions associated with their individual holdings and interactions with the network. Plans are also in place to augment the recently launched Cambridge Blockchain Network Sustainability Index with an estimate of Ethereum’s pre- and post-Merge greenhouse gas emissions and additional network-related insights. Furthermore, we intend to expand the universe of blockchain networks covered on our website beyond Bitcoin and Ethereum.
About the Cambridge Digital Assets Programme
This is the latest in a series of research outputs released under the CDAP umbrella. The CDAP is a multi-year research initiative hosted by the CCAF in collaboration with 14 prominent public and private institutions. The Programme seeks to provide the datasets, digital tools and insights necessary to facilitate a balanced public dialogue about the opportunities and risks a growing digital asset ecosystem presents. The ultimate objective is to help inform evidence-based decision-making and regulation through open-access research.
The CDAP’s institutional collaborators are (in alphabetical order) the Bank for International Settlements (BIS) Innovation Hub, British International Investment (BII), Dubai International Finance Centre (DIFC), EY, Fidelity, UK Foreign, Commonwealth & Development Office (FCDO), Goldman Sachs, Inter-American Development Bank (IDB), International Monetary Fund (IMF), Invesco, Mastercard, MSCI, Visa and World Bank.
APPENDIX 1
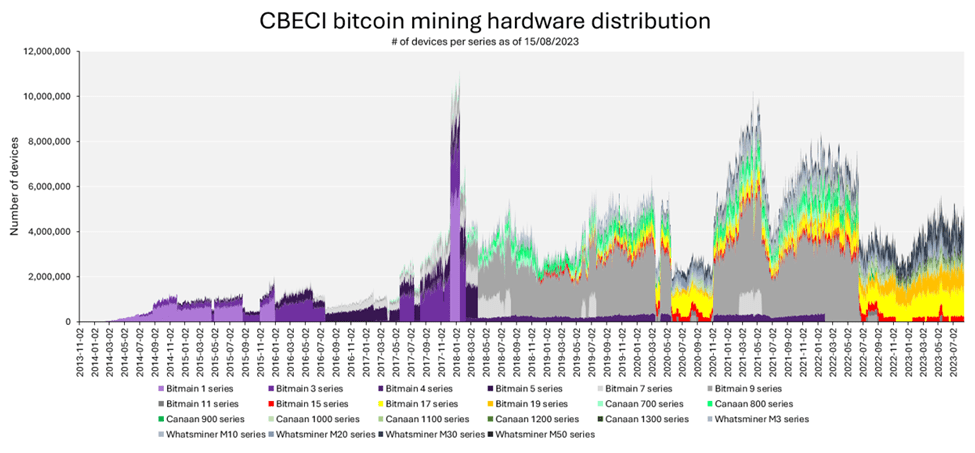
Note: This chart illustrates the assumed distribution of ASIC mining hardware underlying our estimates and is therefore not intended to indicate manufacturers’ market shares or that of a particular model series. It should be viewed as a theoretical tool to derive a hypothetical efficiency estimate of Bitcoin mining hardware that represents the entire industry daily.
APPENDIX 2
Note: This chart illustrates the assumed distribution of ASIC mining hardware underlying our estimates and is therefore not intended to indicate manufacturers’ market shares or that of a particular model series. It should be viewed as a theoretical tool to derive a hypothetical efficiency estimate of Bitcoin mining hardware that represents the entire industry daily.
APPENDIX 3
Additional information: Distribution of Bitcoin mining hardware based on release year. Canaan shows the distribution of all series and models for which sales data is available. Canaan* adjusts this by filtering out all models that were considered unprofitable if the same restrictions in our methodology were applied. All ASIC models indicated in the annual report for each series were checked for their release date. Each series was classified into one of the 5 categories depending on the year of release. Typically, all models of a series were released in one year, but occasionally, new models of an existing series were announced the following year (this applied to the following models: Avalon A852, Avalon A1066 Pro and Avalon 1266). In these cases, all hardware sales of that series were fully attributed to the latest model.
References

A new report by the Cambridge Centre for Alternative Finance examines the market, infrastructure and regulatory conditions under which the tokenisation of real-world assets can scale responsibly in emerging markets and developing economies.

Research centre news
Keys to sustainable open finance in developing economies
A new report by the Cambridge Centre for Alternative Finance (CCAF) at Cambridge Judge Business School and Financial Innovation for Impact (Fii) examines what enables open finance ecosystems to develop and achieve sustainable impact in emerging markets and developing economies (EMDEs). It explores this through a novel framework built on 3 interconnected pillars: incentives, liability and performance measurement. Titled 'Enabling Open Finance in EMDEs: Incentives, Liability, and Performance Measurement', the report has been produced in collaboration with the Bank for International Settlements (BIS), with the support of the UK Foreign, Commonwealth and Development Office (FCDO). Building on CCAF's earlier Global State of Open Banking and Open Finance and APAC State of Open Banking and Open Finance reports, it moves the analysis from where countries have reached towards what sustains an ecosystem over time. Here, we explore its key takeaways.

Research centre news
Report finds uneven AI adoption in financial services
More than 80% of financial services firms are adopting AI to some level and 52% are already experimenting with agentic AI, but impact to date is on efficiency gains rather than business model transformation, says a new report by the Cambridge Centre for Alternative Finance that also highlights big AI risks as reinforced by Anthropic’s new Mythos model.