

Research team from the Cambridge Centre for Alternative Finance (CCAF), unveils new datasets showing geographic shifts in Bitcoin mining – with China’s share declining sharply even before a government crackdown in June 2021.
by Michel Rauchs, Digital Assets Lead at the CCAF
When the Cambridge Bitcoin Electricity Consumption Index (CBECI) was conceived and launched in 2019, it was against a backdrop of growing concerns about the sustainability and environmental impact of Bitcoin mining. Since then, and especially in recent months, the debate around Bitcoin’s seemingly insatiable appetite for electricity has gathered momentum and ignited global debate.
The CBECI, which is an independent platform for reliable information and impartial insights on Bitcoin’s electricity consumption, has regularly been cited in both academic research and global media outlets in their assessments of the status and trends of cryptocurrency mining. Now, a major update of the CBECI digital tool has shone new light on the mining market, suggesting that China’s share of global hashrate (the total computational power of server farms participating in Bitcoin’s consensus process) has been in significant decline for some time prior to the recent crackdown on Bitcoin mining announced by the country’s government in June 2021.
The new data gathered by the CCAF at Cambridge Judge Business School, University of Cambridge, reveals that China’s share of total Bitcoin mining power has declined from 75.5% in September 2019 to 46% in April 2021 – before the restrictions were even imposed. In the same period, the United States’ share of total Bitcoin hashrate increased from 4.1% to 16.8%, putting it in second place. One of the standout observations is the almost six-fold increase of mining share in Kazakhstan. An energy-rich country located in Central Asia, it has seen its share rise from a mere 1.4% in September 2019 to 8.2% in April 2021, catapulting it to third place in global mining power share. The Russian Federation (6.8%) and Iran (4.6%) complete the top five as shown by the chart below.
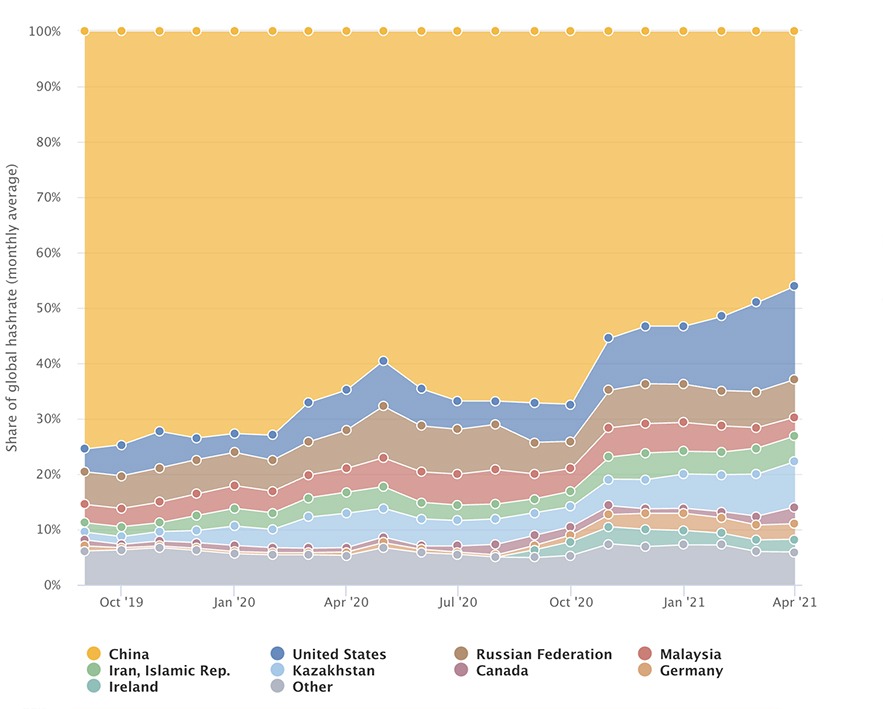
For the first time, this new geolocational data, collected in partnership with four Bitcoin mining pools – BTC.com, Poolin, ViaBTC and Foundry – provides an unprecedented empirical view of the geographical evolution of Bitcoin mining. This exclusive dataset, which represents approximately 37% of the Bitcoin network’s total computing power, confirms for the first time the seasonal migration patterns in China that have only previously been anecdotally observed.
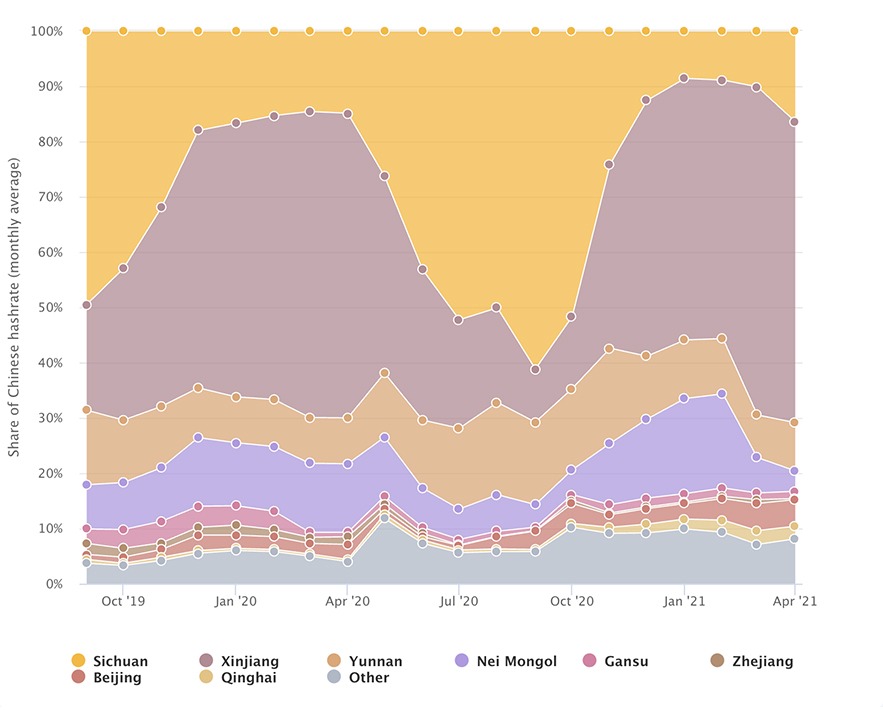
The data reveals the annual migration of miners and their equipment from the Northern Province of Xinjiang in the dry season, to the Southern Province of Sichuan in the rainy season to avail themselves of abundant, and lower priced, hydropower generated electricity. In 2020, Sichuan’s share of China’s total Bitcoin mining power increased from 14.9% at the beginning of the wet season to 61.1% at the peak. Conversely, Xinjiang’s mainly coal-powered hashrate share for the same period decreased from 55.1% at the beginning of the wet season to 9.6% at the lowest point. This seasonal migration has materially affected the energy profile of Bitcoin mining in China, which until now has been by far the largest ‘mining market’, illustrating the complexity of assessing the environmental effects of mining.
However, this seasonal migration pattern within China may well end as the government’s Financial Stability and Development Committee recently banned mining operations in the country. This has effectively led to all of China’s hashrate disappearing overnight, suggesting that miners and their equipment are on the move. Where will they move to? Gains in the US and Kazakhstan might be an indicator, but the next upcoming data updates reflecting the impact of China’s mining ban will provide greater clarity as to where the hashrate has moved. It is hoped that once the initial relocation is completed that updates via a dedicated application programming interface (API) can be delivered monthly from the mining pools.
The research team is working to examine further updates to the tool and underlying datasets and is actively seeking to onboard further mining pools to the list of data contributors to provide as comprehensive a sample as possible – any interested pools should get in touch via the CBECI website.
Other features of the new release of the CBECI include:
- Refinements to the index’s best guess estimate.
- A redesign of the comparisons page with new explanations and comparison data.
- An updated FAQ section to address the key questions received since launch.
- The addition of versioning and downloadable csv files for third-party usage made freely available for the public good.
In the future, the CCAF team plans to examine the ability to link electricity usage and geographic hashrate distribution to greenhouse gas emissions, via a new model, to assess the environmental impact of Bitcoin mining. As institutional investors continue to monitor the cryptocurrency mining market, ESG considerations come further to the fore: uncertainty around environmental credentials could either become an existential threat for the industry or create a market-driven incentive to actively decarbonise – or both. More data and insights are required to inform and facilitate a balanced discussion on evidence. And of course, as the cryptocurrency landscape continues to develop, the team is investigating the potential to extend the analysis to other digital assets and networks. Watch this space!
The author can be contacted at m.rauchs@jbs.cam.ac.uk
Note: this project is part of a broader research stream about the climate aspects of digital assets. Other research streams of the CCAF Digital Assets Programme include the configurations and processes of distributed financial market infrastructure (dFMI) – the collection of blockchain networks and related application ecosystems – as well as emergent money systems like stablecoins and other digital tokens.