

By Alexander Neumueller, Digital Assets CBECI Project Lead
In the last few years, Bitcoin has experienced a surge in popularity, with some even suggesting that the blockchain network has gone mainstream.[1] A recent survey conducted among institutional investors confirms this trend[2] – with the consensus seeming to be that Bitcoin’s reputation has improved and shaken off its negative image of being a hotspot for illegal activity. However, this increasing popularity has highlighted environmental issues associated with the production of Bitcoin, namely the energy-intensive process of ‘mining’, which is essentially about finding a solution to a complex mathematical problem.
Environmentalists, financial institutions and policymakers are growing increasingly concerned about Bitcoin’s seemingly insatiable electricity consumption and its associated environmental repercussions. With an electricity consumption of entire nations, and the international community’s much stronger commitment to intensify decarbonisation efforts to tackle climate change, at first glance, Bitcoin seems to jeopardise those efforts. Understandably, this has sparked a heated debate between proponents and opponents regarding the necessity of regulatory intervention.
For some, Bitcoin is a calamity that will undo decades of environmental progress and could push global warming above 2°C.[3] Proponents counter that Bitcoin could actually help combat climate change and provide a variety of other benefits.[4] Observing the arguments of both sides, some claims seem rather far-fetched and based on over-simplifications, while others are based on scant information.
Given the significant environmental, financial and social interests at stake, there is undoubtedly a political element; interest groups on both sides are vying for interpretive authority to sway public opinion in their favour and persuade policymakers as to the necessity of regulations. This creates a landscape in which important policy and investment decisions may be influenced by biased opinion and cherry-picked data points. Therefore, it is more important than ever to realise that the issue of Bitcoin’s environmental footprint is more nuanced and complex than a quick glance might suggest.
Assembling the building blocks
The Cambridge Bitcoin Electricity Consumption Index (CBECI) was launched in July 2019 in response to the growing demand for reliable data-driven insights about Bitcoin’s electricity consumption. Given the growing public interest in the topic, the CCAF’s work has evolved organically to gradually expand the scope of the Index to eventually provide the necessary building blocks that enable a more complete picture of Bitcoin’s environmental footprint to be offered.
The first version of the index tool was based on a techno-economic model giving insights into the electricity use of global Bitcoin mining activities by providing a daily estimate of electricity consumption. Over time, additional features such as historical power demand and cumulative electricity consumption have been added to the index. However, to better understand the extent of Bitcoin’s environmental footprint, information was needed about the location of Bitcoin mining operations.
To address this knowledge gap, the index tool was updated in May 2020 by integrating a new tool, the Mining Map, which shows the geographical distribution of the hashrate (the computational power provided to the network) over time. The resulting longitudinal dataset, obtained through an exclusive partnership with several major Bitcoin mining pools, is available in monthly intervals, starting from September 2019, and provides unique insights into the geographical location of physical mining operations.
This update (launched September 2022) provides a keystone needed to estimate Bitcoin’s environmental footprint – combining the findings from previous studies with regional data on the energy sources used in power generation. This knowledge is essential to account for differences in the specific electricity mix profile of regions where Bitcoin mining takes place.
Ultimately, the new index tool provides daily estimates of the annualised (ann.) and total greenhouse gas emissions related to Bitcoin. The related estimates will be divided into three time intervals, depending on which data sources were available during the respective period. More information on the methodology employed can be found on the CBECI website. The update also includes a breakdown of Bitcoin’s electricity mix and an emissions intensity (in gCO2e/kWh). Similar to the electricity consumption index, the update will further include a comprehensive section dedicated to comparing Bitcoin’s environmental footprint to other industries, activities and countries.
Key findings
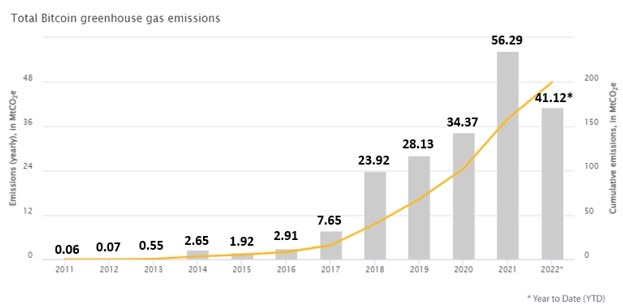
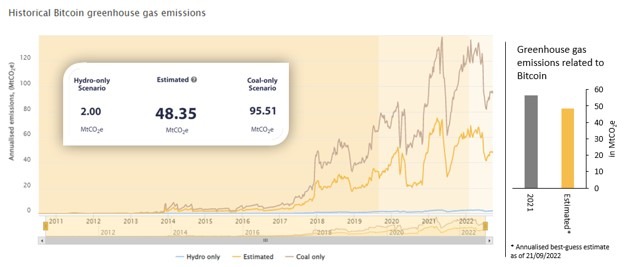
Combining all the previously mentioned findings, the index estimates that by mid-September 2022 (21/09/2022), approximately 199.65 MtCO2e (million tonnes of carbon dioxide equivalent) can be attributed to the Bitcoin network since its inception. It should be noted that about 92% of the emissions have occurred since 2018, as illustrated in Figure 1. While emissions have risen sharply in recent years, today’s picture is different. Currently, we estimate ann. GHG emissions of 48.35 MtCO2e (as of 21/09/2022), which is about 14.1% lower than the estimated GHG emissions in 2021 (56.29 MtCO2e), as shown in Figure 3 (RHS).
Putting our best-guess estimate into perspective, 48.35 MtCO2e represents approximately 0.10% of global greenhouse gas emissions and is similar to that of countries such as Nepal (48.37 MtCO2e) and the Central African Republic (46.58 MtCO2e), or about half that of gold mining (100.4 MtCO2e). More detailed information on how Bitcoin’s emissions compare to other industries, activities, and countries can be found on the CBECI website.
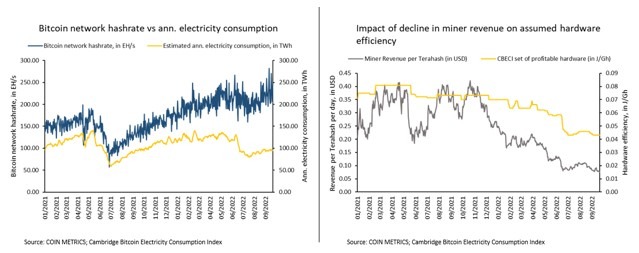
But where does this sudden decrease in estimated GHG emissions come from? In short, a significant decrease in mining profitability led to a decline in electricity consumption despite substantial increases in hashrate. That might seem counter-intuitive at first glance, so let us delve deeper into this statement and explore the reasoning behind it. Figure 2 (RHS) shows the impact of the decline in miner profitability on the hardware selection of Bitcoin miners. A more comprehensive description of the CBECI methodology can be found on the CBECI website. It is based on the assumption that Bitcoin miners are rational economic agents and would therefore only employ profitable hardware.
Given the recent sharp decline in mining revenue per unit of computing power provided, a shift to more efficient hardware occurs, which leads to the, at least temporary, retirement of older, less efficient hardware. This assumption seems to be confirmed by anecdotal evidence of Bitcoin miners.[5] Observing the chart on the left-hand side in Figure 2, the effects of this transition become more evident. Comparing the growth of Bitcoin network hashrate and estimated ann. electricity consumption between 1 January 2021 and 21 September 2022, hashrate increased from 137.76 EH/s to 242.13 EH/s (+75.8%), while estimated annual electricity consumption declined from 96.48 TWh to 95.42 TWh (-1.1%). Ultimately, the assumed increase in efficiency of mining hardware is responsible for the annual GHG emissions estimate (as of 21/09/2022) being fairly below the 2021 level.
In addition to the best-guess estimate (orange line), Figure 3 further presents 2 outlier scenarios, namely emissions if the whole network was powered solely by hydropower (blue line) or solely by coal power (grey line), defining the range that encompasses our best-guess estimate. These 2 energy sources have been chosen to show the vast difference in GHG emissions at any given level of electricity consumption depending on the energy source that powers the network, with hydropower representing the best-case scenario and coal power the worst-case. In the hydro-only assumption, Bitcoin would be responsible for about 2.00 MtCO2e; this number increases by a factor of more than 47 to 95.51 MtCO2e in the coal-only scenario. This striking difference highlights the importance of studying Bitcoin’s electricity mix in greater detail and the need to distinguish between electricity consumption and climate impact. Although the 2 are inextricably linked, they are not the same.
On that note, it is important to emphasise that the approach to estimating Bitcoin’s environmental footprint is based on a theoretical model that uses publicly available data rather than actual observations. This leads to a number of notable limitations in the methodology underlying the estimate. For example, activities that might be expected to reduce emissions, such as the use of flare-gas, off-grid (behind the meter) Bitcoin mining, waste heat recovery, or carbon offsets, to name a few, are not accounted for. Since a detailed list of methodological trade-offs is beyond the scope of this post, a more complete list of limitations can be found on the CBECI website.
How sustainable is Bitcoin mining?
The new tool also provides more detailed information on Bitcoin’s electricity mix. When observing the most recent month available (January 2022), it was found that coal was the largest single energy source with a share of 36.6% and hydropower was the largest sustainable energy source with a share of 14.9%. Overall, the results show that fossil fuels account for almost two-thirds of the total electricity mix (62.4%) and sustainable energy sources 37.6% (of which 26.3% are renewables and 11.3% nuclear). The findings thus noticeably deviate from industry findings that estimate the share of sustainable energy sources in Bitcoin’s electricity mix to be 59.5%.[6]
Using CBECIs latest available data, Bitcoin’s estimated electricity mix corresponds to an emission intensity of 506.71 gCO2e/kWh. Since it is not yet possible to comment on how the emission intensity changed from 2021 to 2022, as only January data is currently available, Bitcoin’s average emission intensity in 2020 (491.24 gCO2e/kWh) was compared to that of 2021 (531.81 gCO2e/kWh), suggesting that the sustainability of the electricity mix has deteriorated.
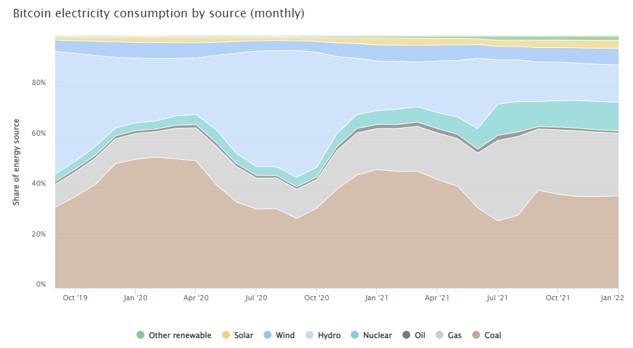
Figure 4 illustrates Bitcoin’s electricity mix over time since data has been available. As of 2021, the fluctuations in the electricity mix have become visibly less volatile. The reason for these previous variations was the relocation of Bitcoin mining operations within China depending on the season. Prior to the government-mandated ban on cryptocurrency mining in China in June 2021, opportunistic miners took advantage of favourable electricity rates during the rainy season in late spring/autumn, which is when water levels rise, by moving from thermal-powered regions to those where hydropower was abundant. During this period, the share of hydropower peaked at 48.7% and 50.4% in 2019 and 2020, respectively, and bottomed out at 25.6% and 19.0% (being predominantly replaced by coal) in late autumn/spring (the dry season) when miners migrated back to the thermal-powered regions as water levels dropped. Therefore, accounting for seasonal relocations was crucial as those significantly altered the electricity mix. However, while China still accounted for more than three-quarters of the total hashrate in September 2019, thus substantially influencing Bitcoin’s electricity mix, its share gradually declined over the following recorded months, bottoming out at 0% in July 2021.
Whilst the latest update revealed a sudden rebound in China’s hashrate share from 0% in July and August 2021 to 22.3% in September 2021, the country’s impact on the overall electricity mix remains limited as its share has been considerably lower in the latest recorded months than compared to 2019 and 2020. Overall, however, the deterioration in Bitcoin’s associated emission intensity from 2020 to 2021, driven by the absence of seasonal relocations within China suggests that the Chinese government’s ban on cryptocurrency mining and the resulting shift in Bitcoin mining activity to other countries negatively impacted Bitcoin’s environmental footprint.
Whilst it is assumed that seasonal relocations within China ceased after the mining ban came into effect, it nonetheless demonstrates the importance of considering the location of mining activities when examining Bitcoin’s climate impact. Each observed region has its own electricity mix profile that affects the emission intensity of Bitcoin mining, depending on the energy sources used to generate electricity in the region. For example, while in countries like Sweden the share of sustainable energy sources in electricity generation is about 98%, countries like Kazakhstan still rely heavily on fossil fuels, and sustainable energy sources only account for less than 11% of the electricity mix.[7] Therefore, when determining Bitcoin’s environmental footprint, it is paramount to allocate the appropriate share of the total hashrate to each region.
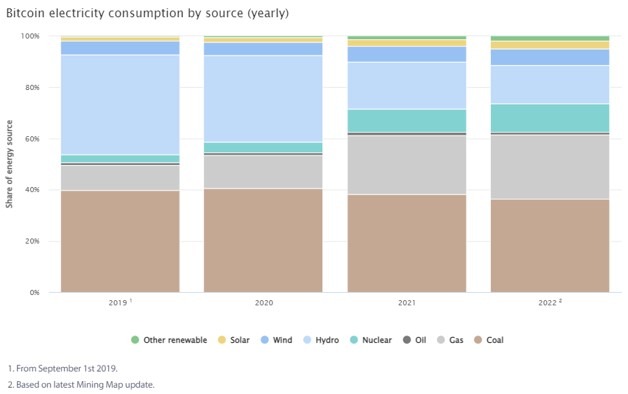
Overall, some trends become apparent when looking at annual data (Figure 5). With the gradual decline in China’s share of the total hashrate, Bitcoin’s electricity mix became more diverse. While hydropower and coal power accounted for 33.7% and 40.4% in 2020, their shares decreased to 18.5% and 38.2% in 2021, respectively. In contrast, the shares of gas (from 12.8% in 2020 to 23.0% in 2021) and nuclear (from 4.0% in 2020 to 8.9% in 2021) increased significantly, reflecting the shift of mining power towards the United States. As previously mentioned, the years 2019 and 2022 should be treated with caution as data is not available for the entire year.
A glance into the future
The Bitcoin mining industry is constantly changing, and this evolution needs to be captured and reflected into future assessments. Consequently, this tool will continue to be adjusted, and the methodology, over time will gradually move from the abstract to the real world as more data becomes available and allows for greater granularity. Interesting concepts and developments are already emerging around Bitcoin mining. These range from waste heat recovery[8] to using flare-gas[9] and Bitcoin mining as a means to minimise renewable energy curtailments[10] to serving as a catalyst for renewable infrastructure projects.[11] Time will tell if these are merely novel ideas that fail to deliver on their promise, or if they will become a more integral part of the Bitcoin mining industry in the future. Moreover, after the last Mining Map update, new data that would shed light on the most recent developments in the distribution of the global hashrate, and thus how the electricity mix has changed during this period, is still unavailable. It is hoped to provide more clarity on this matter in future updates.
Furthermore, as CBECI is dedicated to Bitcoin, work is well advanced on a new platform to expand the scope of the CDAP research on electricity consumption to a variety of other blockchain networks.
As part of this update, a variety of visual changes have been implemented and functionalities added to the website to enhance user experience. A full list of all changes can be found on the CBECI website. The CCAF looks forward to continuing working with its partners and network to further improve the index tools and always welcome constructive feedback and suggestions from the ecosystem. You can get in touch with the team via the CBECI website.
About the Cambridge Digital Assets Programme
This is the latest in a series of research outputs released under the Cambridge Digital Assets Programme (CDAP) umbrella. The CDAP is a multi-year research initiative hosted by the Cambridge Centre for Alternative Finance (CCAF) in collaboration with 16 prominent public and private institutions. The Programme seeks to provide the datasets, digital tools and insights necessary to facilitate a balanced public dialogue about the opportunities and risks presented by a growing digital asset ecosystem, with the ultimate objective to help inform evidence-based decision-making and regulation through open-access research.
The CDAP’s institutional collaborators are (in alphabetical order) Accenture, Bank for International Settlements (BIS) Innovation Hub, British International Investment (BII), Dubai International Finance Centre (DIFC), EY, Fidelity, UK Foreign, Commonwealth & Development Office (FCDO), Goldman Sachs, Inter-American Development Bank (IDB), International Monetary Fund (IMF), Invesco, London Stock Exchange Group (LSEG), Mastercard, MSCI, Visa and World Bank.
References
[1] Hindley, D. (2022) “What can the past tell us about Bitcoin’s future?” Financial Times
[2] (2022) “UK institutional investors anticipate uplift in crypto holdings.” Finextra Research
[3] Kruse, T. (2022) “Change the code: not the climate – Greenpeace USA, EWG, others launch campaign to push Bitcoin to reduce climate pollution.” Greenpeace USA
[4] (2022) “Bitcoin is key to an abundant, clean energy future.” Square & ARK Invest
[5] Szalay, E. (2022) “Bitcoin miners stung as fallout from price collapse widens.” Financial Times
[6] (2022) “Bitcoin mining electricity mix increased to 59.5% sustainable in Q2 2022” Bitcoin Mining Council, 19 July
[7] Ritchie, H., Roser, M. and Rosado, P. (2020) “Electricity mix.” Our World in Data
[8] (2021) “Green innovation in Bitcoin mining: recycling ASIC heat.” Braiins
[9] Snytnikov, P. and Potemkin, D. (2022) “Flare gas monetization and greener hydrogen production via combination with cryptocurrency mining and carbon dioxide capture.” iScience, 25(2): 103769
[10] Niaz, H., Liu, J.J. and You, F. (2022) “Can Texas mitigate wind and solar curtailments by leveraging Bitcoin mining?” Journal of Cleaner Production, 364: 132700
[11] Carter, N. (2021) “Bitcoin mining is reshaping the energy sector and no one is talking about it.” CoinDesk

Research centre news
Report finds uneven AI adoption in financial services
More than 80% of financial services firms are adopting AI to some level and 52% are already experimenting with agentic AI, but impact to date is on efficiency gains rather than business model transformation, says a new report by the Cambridge Centre for Alternative Finance that also highlights big AI risks as reinforced by Anthropic’s new Mythos model.

Research centre news
Cambridge launches digital identity regulatory initiative
The Cambridge Centre for Alternative Finance (CCAF), through the Cambridge DPI Regulatory Programme: Digital Identity, is convening global experts to explore how research, regulation and adoption intersect in digital identity ecosystems. A launch event sets the agenda for generating practical evidence to inform smarter, more inclusive DPI policymaking worldwide.

Led by Financial Innovation for Impact (Fii), in collaboration with the Cambridge Centre for Alternative Finance (CCAF) at Cambridge Judge Business School, University of Cambridge, a new research initiative has been launched exploring the adoption and use of digital public goods (DPGs) or open-source solutions within government-to-person (G2P) payment systems. The study aims to provide evidence and insights to guide governments and partners in adopting and implementing open-source G2P solutions.