

By Alexander Neumüller, CCAF Research Lead, Digital Assets Climate Impact, Cambridge Judge Business School, University of Cambridge
Article breakdown
Overview
The environmental impact of blockchain technology is a widely debated topic, chiefly due to the energy-intensive nature of Bitcoin. However, while blockchain is the underlying technology that supports Bitcoin, it has many other applications, ranging from private to public blockchain networks, with various consensus methods. Unfortunately, these distinctions are not always adequately appreciated in discussions. Therefore, it is imperative to evaluate the entire ecosystem’s environmental impact more thoroughly, considering these important differences. This will allow us to develop a more nuanced understanding of the environmental implications of different applications of this technology.
At the Cambridge Centre for Alternative Finance (CCAF), we acknowledged this necessity and extended our research to Ethereum. The launch of the Cambridge Blockchain Network Sustainability Index (CBNSI) marked a significant step, initiating our ongoing efforts to include more blockchain networks in the scope of our research. The initial iteration of this platform detailed Ethereum’s electricity consumption pre- and post-Merge. The launch of the Cambridge Blockchain Network Sustainability Index (CBNSI) in April this year was a first step towards shedding light on the electricity consumption of blockchain networks beyond Bitcoin, albeit without the granularity that the Cambridge Bitcoin Electricity Consumption Index (CBECI) had.
The data on Ethereum’s electricity usage offered a glimpse, yet lacked a comprehensive depiction of the network’s environmental footprint, given that electricity usage, while vital, is merely one element of an environmental impact assessment. To fill the information gap, further research was essential to gather the data required to convert electricity consumption into greenhouse gas (GHG) emissions, thus enabling the provision of ongoing emission estimates and a deeper dive into Ethereum’s historical emissions debt, or in other words, GHG emissions accrued before the network’s shift to a proof-of-stake (PoS)-based consensus mechanism.
This update fills the knowledge gap between electricity consumption and GHG emissions. As previously alluded, while electricity consumption and climate impact are inextricably linked, they are not the same and hence need to be distinguished. We addressed this by leveraging our understanding of the geographical distribution of Ethereum nodes by extracting geolocational information from P2P message exchanges between nodes and monitoring node activity over time. The generated longitudinal dataset furnishes invaluable insights, enabling the mapping of node activity to specific geographical regions, which functions as the cornerstone for computing a network-specific emissions intensity.
This latest iteration not only enables the computation of Ethereum’s future emissions but also delves into assessing the network’s historical emission debt, from its inception (Genesis) to The Merge. This period is critical as it covers the era in which Ethereum relied on a PoW-based consensus mechanism, thereby offering critical insights into its environmental impact during this phase.
In both cases, this update provides the final piece needed for a more complete understanding of Ethereum’s current and historical GHG emissions by synthesising findings from previous studies with regional data on the energy sources used in power generation. This knowledge is essential to account for differences in the specific electricity mix profile of regions where nodes are operated and allows for all the missing building blocks of a comprehensive environmental impact assessment to be linked together.
Ultimately, this new tool will add to our index daily estimates of Ethereum’s pre- and post-Merge annualised and total GHG emissions, as well as the network’s electricity mix and the corresponding emissions intensities.
As we have done in the past, we will continue to undertake new research initiatives that help us achieve even greater granularity to eventually arrive at a full lifecycle assessment for all our climate impact assessments of various networks. Aside from our ambitions to introduce new content, we aim to evaluate and refine, as required, existing methodologies and establish new collaborations to access unique data sets, which should help facilitate a gradual transition from theoretical approximations to the most precise estimates achievable.
Ultimately, this new tool will add to our index daily estimates of Ethereum's pre- and post-Merge annualised and total GHG emissions, as well as the network's electricity mix and the corresponding emissions intensities.
Our research journey: moving from electricity consumption to greenhouse gas emissions
The Cambridge Blockchain Network Sustainability index was launched in April 2023 in response to the growing demand for reliable data-driven insights about Ethereum’s pre- and post-Merge electricity consumption, particularly with respect to quantifying the impact of The Merge on electricity consumption and by extension the environment. Given the mounting public interest in the topic, the CCAF has undertaken an effort to study this subject in more detail and fulfil its long-held ambitions to move beyond providing estimates solely for Bitcoin. This study is a natural extension of our work on electricity consumption that bridges the gap between electricity usage and climate impact, thus providing a more complete picture of Ethereum’s current and historical environmental footprint.
The initial release of the CBNSI in April featured methodologies specifically designed to address the unique characteristics of Ethereum. These methodologies were distinctively tailored to evaluate the network’s environmental impact under both the PoW and the PoS-based consensus mechanisms. This dual approach ensures a comprehensive understanding of the climate impact during both operational phases.
The pre-Merge assessment is based on a techno-economic model akin to that applied in Bitcoin to analyse the historical electricity use of global Ethereum mining activities. However, a comprehensive understanding of Ethereum’s environmental footprint pre-Merge required knowledge of the mining operations’ geographical locations. Lacking a mining map for pre-Merge Ethereum comparable to that of Bitcoin, we relied on a combination of alternative methods and existing literature to deduce the geographical distribution of mining activities.
In the case of post-Merge Ethereum, a new approach was devised that deviates from the techno-economic approach employed for networks that rely on a PoW-based consensus mechanism. To that end, off-chain data extracted from the P2P communication of Ethereum nodes was utilised to ascertain electricity usage and the geolocational distribution of nodes. The resulting longitudinal dataset is available in monthly intervals on our ccaf.io website.
In both cases, the findings from previous studies are combined with regional data on the energy sources used in power generation in the identified regions. This knowledge is essential to account for differences in the specific electricity mix profile of regions where (mining) node activity has been observed when devising a network-specific electricity mix.
Ultimately, the new index tool provides daily estimates of annualised and total GHG emissions for Ethereum pre- and post-Merge. Estimates are divided into three time intervals, depending on which data sources were available during the respective period. This approach mirrors the logic applied in our Bitcoin GHG emissions assessment. More information on the methodologies used for Ethereum before and after The Merge can be found on our website.
Moreover, the update also includes a breakdown of the post-Merge electricity mix and the pre- and post-Merge emissions intensities (in gCO2e/kWh). Additionally, the update introduces a comparison segment dedicated to contextualising our findings. This segment involves benchmarking Ethereum’s post-Merge emissions against other emissions and carbon sequestration sources, effectively illustrating the scale of the network’s environmental impact.
Exploring Ethereum’s historical climate impact
Historically, Ethereum has relied on a PoW-based consensus mechanism to authenticate transactions and add new blocks to the ledger. To secure the block reward, so-called miners are required to find a solution to a cryptographic puzzle, solvable only through brute-force (trial-and-error), necessitating vast amounts of computational resources and, consequently, energy. This energy-intensive process, along with the financial resources it consumes, served as a deterrent against malicious behaviour and ensured the security and integrity of the network until The Merge altered this security model.
Ethereum’s native token, Ether (ETH), was predominantly mined using graphics processing units (GPUs) and, to a lesser extent, application-specific integrated circuits (ASICs). This can be attributed to the Ethereum founders adopting an ASIC-resistant protocol design1,12 which facilitated an environment that rendered more geographically diverse mining operations economically feasible, as will be discussed later.
The initial focus of this section is the geographical distribution of Ethereum mining, as understanding this aspect forms the basis for the subsequent emissions-related research. Afterwards, differences between the mining landscapes of Ethereum and Bitcoin are examined. Subsequently, likely reasons for the observed differences are discussed. The section concludes with an examination of Ethereum’s historical emission estimates, and a scenario analysis that shows how the estimates vary depending on the assumed electricity mix. Ultimately, we hope that these findings will help ecosystem stakeholders to better understand Ethereum’s emissions debt that accrued before the network transitioned to PoS.
Mapping the evolution of the Ethereum mining landscape
In the previous iteration of the CBNSI, we already provided insights into the network’s electricity usage before The Merge. Given the decentralised nature of the Ethereum network, and considering that nearly a year has passed since The Merge, there were considerable challenges that limited our ability to obtain pertinent information on the geographical distribution of mining activity. To this end, we relied on existing literature and on-chain data, with the latter forming the cornerstone of our research.
To determine the geographical region where a block was likely mined, we employed a block allocation algorithm that screens blocks for relevant information, subsequently categorising them into two groups: those containing useful data and those that did not contain such data. In this context, ‘relevant information’ refers to heuristics that enabled us to associate a geographical region with a block. Once all blocks had been screened and allocated accordingly, they were grouped together and formed a map that provided insights into how the Ethereum mining landscape has changed over time. More detailed information on the employed methodology can be found on the ccaf.io website.
While the model itself uses more granular information, for illustrative purposes, Figure 1 depicts the geographical distribution between the three largest regions we could identify (namely, Asia, Europe, and North America). Initially, for close to a year, Ethereum mining had a strong foothold in Europe, with the region playing a significant part in the mining ecosystem. Over time, although Europe’s share diminished somewhat, mining activity consistently maintained traction in the region. The reasons for this can be manifold.
One possible reason could be linked to the network’s ASIC-resistant protocol design. This design choice was likely influential in shaping the mining landscape; while increased usage of ASICs favours large-scale mining operations with purpose-built data centres (so-called ‘mining farms’),2 Ethereum’s ASIC resistance may have helped levelling the playing field. It allowed at-home miners to remain competitive without the need for the technical infrastructure required to operate ASIC devices.
The comparatively more user-friendly method of mining using GPUs and more favourable cost-to-revenue ratio — a topic we will explore later — could have played a decisive role in Europe’s proliferation in Ethereum mining, peaking at nearly 70% in early 2016, and the region’s continued relevance as the ecosystem matured.
Contrastingly, Asia experienced a slow start in Ethereum mining but quickly caught up, eventually overtaking much of Europe’s early dominance. The region’s share peaked at nearly 60% of global Ethereum mining activity by the end of 2019. Noteworthy is the decline in Asia’s mining activity from April 2020, initially subtle but becoming significantly pronounced post regulatory changes in China, notably the ban on cryptocurrency mining.
North America, on the other hand, appeared to play a relatively minor role in the Ethereum mining landscape over time. A detailed examination of the data shows that after a slight increase in early 2016, North America’s share contracted from late 2018 until early 2020, followed by a modest expansion. Throughout this period, North America’s share oscillated between approximately 6 and 18%.
The ‘Others’ category encompasses all blocks that our block allocation algorithm could not attribute to either Asia, Europe, or North America. Delving into the intricacies of the allocation and attribution process is beyond the scope of this article; the analysis here is kept at a high level. For more detailed insights, we invite readers to visit the ccaf.io website.
Due to the absence of a specific mining map for Ethereum, as we have for Bitcoin, our approach involved analysing on-chain data and consulting relevant literature to map blocks to geographic regions. One method entailed screening blocks for heuristics in the ‘extra data’ field where miners could add arbitrary information.3 Another involved relying on information obtained by Silva et al. (2020), who linked a specific geographical distribution to mining pools by operating nodes in various locations and observing block propagation delays.4
When examining the collected data, the scarcity of information available close to Ethereum’s genesis becomes apparent, evidenced by the attribution of nearly 100% of blocks to the ‘Others’ category. However, this quickly changed and the proportion of blocks that could not be categorised fell to around 70% in the second month and to less than 40% in the third. This trend did not surprise, given that mining infrastructure, like mining pools, required time to develop and mature.
Notably, the decrease in blocks allocated to Asia coincided with an uptick in unattributed blocks. This trend suggests that some mining pools may have ceased to add relevant information, or miners shifted their strategies, either opting for pools for which regional data was not available or choosing to mine independently without joining any pool.
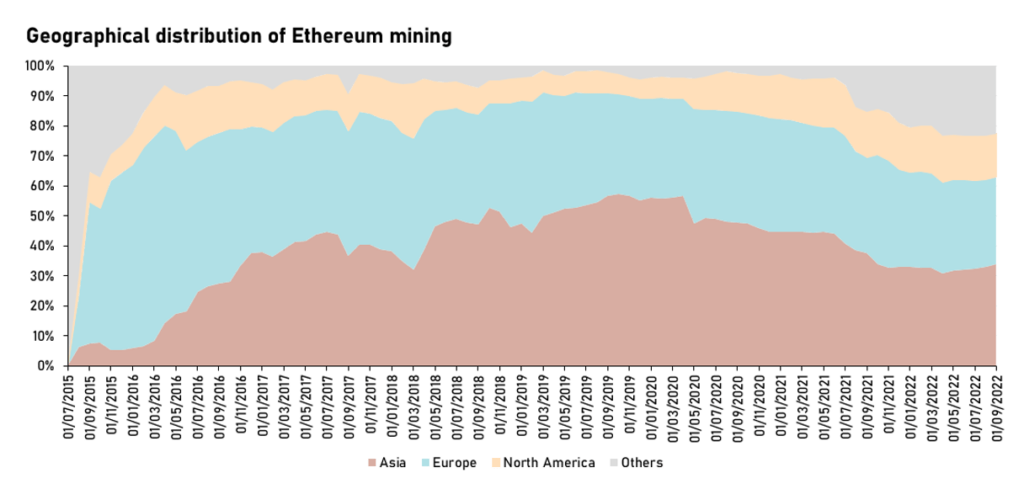
Figure 1: Distribution of Ethereum mining activity across Asia, Europe, North America, and Others | Source: CCAF
Another intriguing aspect is the examination of the differences in geographical distribution of mining activity between Ethereum and Bitcoin. To this end, Figure 2 presents geolocational information for both networks from September 2019 until January 2022. This time frame was selected due to the limitations in the availability of Bitcoin data.
Notably, during 2019 and 2020, Ethereum demonstrated greater geographical diversity in its mining activity compared to Bitcoin. While Asia played a major role in mining for both networks, its dominance was more pronounced in Bitcoin. Until October 2020, more than 80% of Bitcoin mining activity was located in Asia (predominantly in China),5 while, during the same period, Ethereum mining activity in the region oscillated between 47% and 57%. In both cases, a drop in mining activity can be observed after the cryptocurrency mining ban in China, but the drop in Bitcoin mining activity post-ban is noticeably more pronounced. This suggests that China likely played a significantly more prominent role in Bitcoin than it did in Ethereum mining.
The dynamics of mining activity in North America reveal notable differences between Ethereum and Bitcoin. During the observed period, North America consistently played a rather minor role in Ethereum mining, accounting for an average of around 12%. The same cannot be said for Bitcoin. While Bitcoin mining in North America was less pronounced than Ethereum mining until the end of 2020, this drastically reversed the following year. In 2021, the share of North America in global Bitcoin mining activity quadrupled from 11% in January 2021 to 44% in January 2022, driven by a dramatic surge in mining activity in the United States, which alone accounted for nearly 38% of global mining activity at that time, likely partly catalysed by a miner exodus from China.6
Ethereum mining has historically been more prominent in Europe compared to Bitcoin mining. On average, approximately 35% of Ethereum’s mining activity was based in Europe during the observed period, while that of Bitcoin mining averaged around 13%. This disparity may stem from several factors. One plausible explanation is a different competitive landscape, which permitted profitable operations even at higher electricity rates, unlike Bitcoin mining’s more cost-sensitive environment.
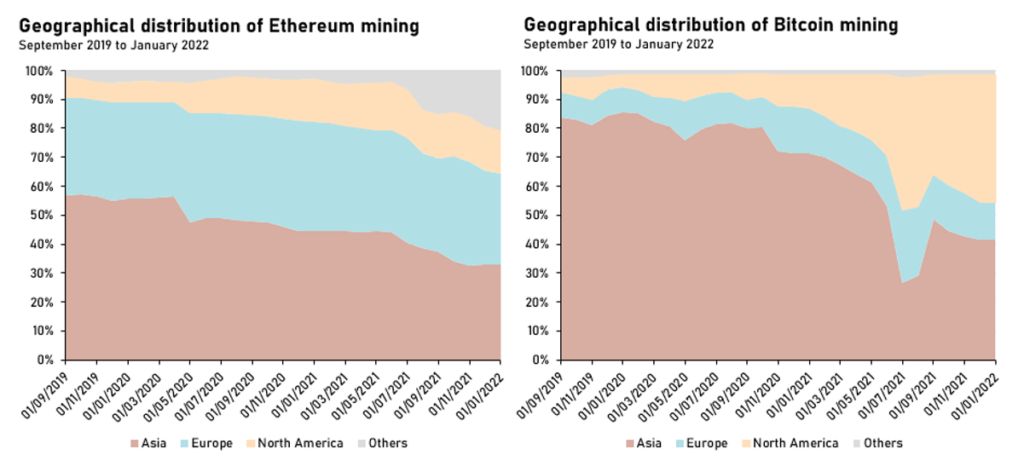
Figure 2: shows (a) the distribution of Ethereum mining activity across Asia, Europe, North America, and Others from September 2019 to January 2022 and (b) shows the distribution of Bitcoin mining activity across Asia, Europe, North America, and Others from September 2019 to January 2022. | Source: CCAF
The aforementioned cost sensitivity will now be further explored by investigating the competitive landscapes of Ethereum and Bitcoin mining. To this end, Figures 3(a) and 3(b) illustrate the cost-revenue ratios (CRRs) of Bitcoin and Ethereum from September 2015 to September 2022.
Ethereum’s mining CRR trajectory showcases a persistently favourable economic outlook, with costs seldom breaching the 40% mark of revenue until mid-2018, and never surpassing the critical 100% threshold throughout the period under review. This suggests sustained profitability, even amidst more challenging market environments.
In contrast, the Bitcoin mining CRR depicts a more volatile course. Initially, up to mid-2017, the CRR hovers around the 50% mark, with occasional peaks and troughs, followed by a more favourable environment until mid-2018. From there, the CRR shows a general upward trend with periods of pronounced fluctuation, occasionally eclipsing the 100% mark in 2020.
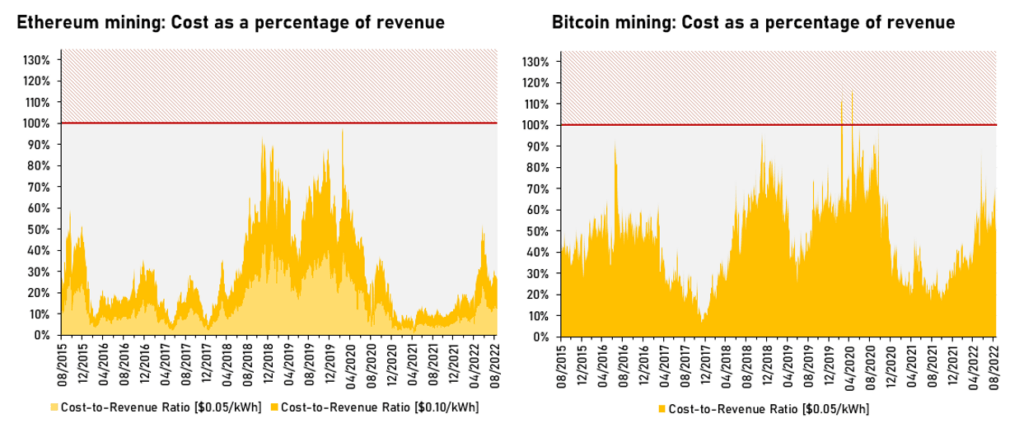
Figure 3: shows (a) the cost-to-revenue ratio of Ethereum mining from August 2015 to September 2022, and (b) the cost-to-revenue ratio of Bitcoin mining from August 2015 to September 2022. Operating costs were computed by relying on the hardware efficiency estimates of our Bitcoin and Ethereum electricity consumption models and the respective electricity rates. Revenue was derived from block rewards. | Source: CCAF, Coin Metrics
Importantly, when analysing the impact of electricity costs, Ethereum’s CRR remains consistently below Bitcoin’s across the two different electricity rate assumptions, accentuating Ethereum’s cost efficiency in mining operations. Even with elevated electricity costs of $0.10/kWh, Ethereum’s CRR has generally stayed below Bitcoin’s, indicating that Ethereum mining was a more cost-effective endeavour overall.
This economic advantage becomes even more pronounced at the lower electricity cost of $0.05/kWh.
Thus, the analysis of this seven-year period reveals that Ethereum mining had been almost consistently more stable and profitable, even at higher electricity rates, which could have contributed to the comparatively larger share of mining activity in Europe.
Ethereum’s legacy: quantifying the network’s emissions debt
In a previous article (April 2023), we introduced our work on Ethereum’s pre-Merge electricity consumption. Although this study signified a crucial preliminary step, it did not capture the geographical distribution of mining activity, thus missing a vital component for a more comprehensive environmental impact assessment. With the geographical information presented previously, this critical element has been added, allowing us to form a better understanding of the energy sources that were utilised in Ethereum mining.
Synthesising all our previous findings, we estimate GHG emissions attributable to Ethereum mining at 27.5 MtCO2e since the network’s inception until its transition to PoS. It should be noted that nearly 60% of the total emissions during that time occurred in 2021 and 2022, as illustrated in Figure 4(a). Putting this into perspective, 27.5 MtCO2e represented approximately 0.06% of global greenhouse gas emissions in 2020 and is comparable to the emissions of countries such as Honduras (27.67 MtCO2e) and Lebanon (28.87 MtCO2e),7 or to that of video gaming in the US (24 MtCO2e).8
While it can be observed that emissions rose sharply in 2021 and 2022, examining the entire observed period presents a less consistent picture. Most notably, 2019 and 2020 broke the trend of yearly emission increases from the prior years. An explanation for this phenomenon can be found in the decreased amount of computational power provided to the network by miners (see Figure 4(b)). This chart also elucidates the underlying reasons for the stark increases in emissions in 2021 and 2022, as the computational power soared in 2021 and remained at that elevated level until The Merge was successfully implemented. In turn, the reason for the soaring hashrate can be attributed to the heightened profitability of Ethereum mining during this period (see Figure 3(a)).
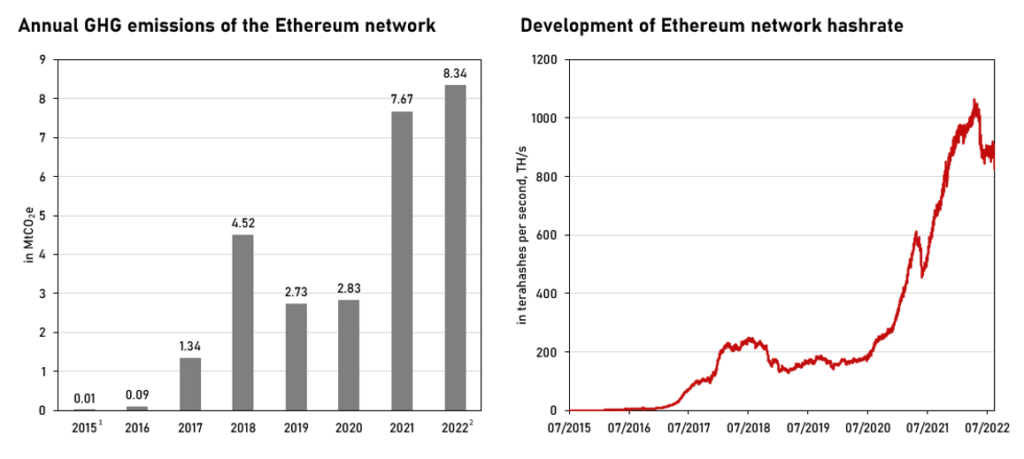
Figure 4: shows (a) the annual GHG emissions of the Ethereum network, and (b) the Ethereum network hashrate.
Note: 1from 27 August 2015, 2until 14 September 2022| Source: CCAF, Coin Metrics
In addition, we performed a sensitivity analysis (see Figure 5) to assess how emission estimates vary with changes in key parameters. Accurately calculating exact GHG emissions is challenging, which prompted us to use a hypothetical range encompassing three scenarios. One of these scenarios is a hypothetical best case (blue line) assuming all miners exclusively used hydropower, while the other represents a hypothetical worst case making the same thought experiment with coal-fired power (grey line). These two outlier scenarios encapsulate the estimate we deem most reliable (orange line). We provided these additional scenarios to showcase the vast difference in emissions at any given level of electricity consumption depending on the energy source that powers the network. In the hydro-only scenario, Ethereum’s emission debt would have amounted to only about 1.2 MtCO2e (see Figure 5(a)); this number increases by a factor of more than 47 to 58.3 MtCO2e in the coal-only scenario. This striking difference highlights the importance of studying Ethereum’s electricity mix in great detail and the need to distinguish between electricity consumption and climate impact, as, although the two are inextricably linked, they are not the same. Alongside the cumulative emissions estimate, Figure 5(b) shows annualised emission estimates over time.
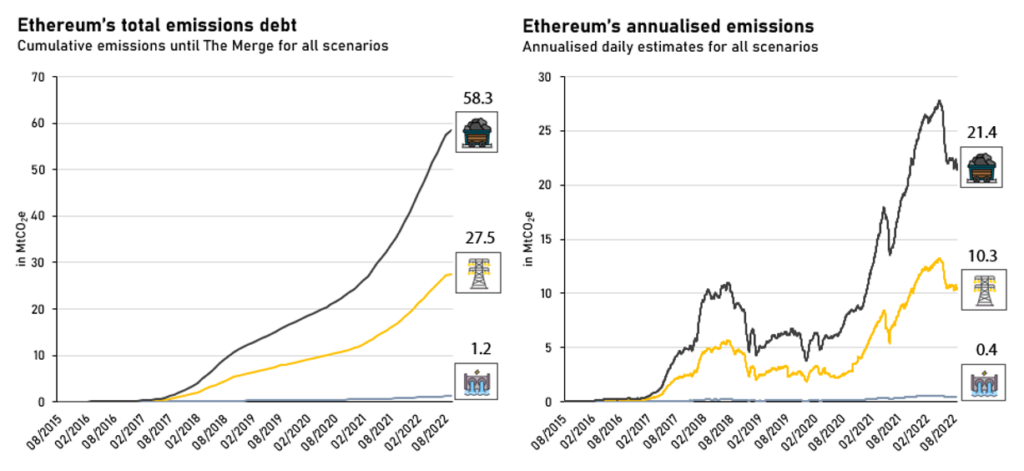
Figure 5: shows (a) Ethereum’s cumulative GHG emissions from August 2015 to September 2022, and (b) Ethereum’s daily annualised GHG emission estimates from August 2015 to September 2022 | Source: CCAF
It is important to emphasise that the approach to estimating Ethereum’s historical environmental footprint is based on a theoretical model that uses publicly available data rather than actual observations. This leads to a number of notable limitations in the methodology underlying the estimate, but a more detailed discussion of those is beyond the scope of this article. If you are interested in learning more about the methodological trade-offs, please visit the relevant segment on the ccaf.io website.
A new chapter: Ethereum’s climate impact post merge
The Merge in a nutshell
The Ethereum Merge represented a significant technological milestone in the history of blockchain technology, heralding the network’s transition from PoW to PoS. This change was rooted in Ethereum’s origins in 2015, where it initially adopted PoW due to its proven success in Bitcoin and the relative novelty of PoS systems. However, the idea of moving to PoS was embedded in Ethereum’s roadmap from the start.9 Vitalik Buterin, Ethereum’s co-founder, had envisioned this shift, anticipating the benefits of increased scalability and energy efficiency. The PoS model promised to process a higher number of transactions per second and reduce the significant energy consumption associated with PoW.
In December 2020, Ethereum took a crucial step towards this vision with the launch of the Beacon Chain. This new chain operated in parallel with the existing Ethereum Mainnet but under a PoS-based consensus mechanism. The Beacon Chain did not initially process Mainnet transactions; its role was to establish and maintain a PoS consensus about its own state and active validators. This phase was essential for testing and ensuring the stability and security of the PoS system before its full integration with the Mainnet.
The Merge, completed in September 2022, was the final act in this transition. It saw the merging of the original Ethereum Mainnet, running on PoW, with the Beacon Chain’s PoS system. This event marked a significant reduction in Ethereum’s energy consumption, dropping by about 99.99%10 and setting the stage for future scalability improvements. The Merge was more than just a technical upgrade; it was a strategic shift towards a more sustainable, efficient and scalable blockchain, reflecting Ethereum’s ongoing commitment to innovation and its responsiveness to the evolving needs of its ecosystem.
The implications of the Ethereum Merge extend far beyond its immediate technical upgrades. It marks a significant advancement in environmental sustainability and network scalability. The latter has been achieved primarily through the introduction of several novel techniques.11
The community has acknowledged the limitations of the first sharding approach and delegated the scalability to Layer 2 solutions like optimistic and zk-rollups.12 These Layer 2s can facilitate higher transaction speeds and lower costs by executing transactions off the main chain but leveraging its security. From a future perspective, these protocols are intended to be combined with a new data-sharing schema called “danksharding”,13 which relies on data availability sampling to increase the block space while adding blob transactions. These transactions can access cheap and not-on-chain stored space while reducing the overall operation cost for Layer 2 protocols.
Thus, by addressing the network’s data throughput challenges, danksharding and Layer 2 protocols are a critical step towards alleviating Ethereum’s historical limitations in transaction processing and high gas fees, paving the way for a more robust, efficient, and scalable blockchain ecosystem.
Mapping the geographical distribution of Ethereum nodes
Before delving into our emission estimates of post-Merge Ethereum, let us first explore the backbone of the network: nodes and validators.
In our last Ethereum-related article, published in April this year, we not only examined the network’s electricity consumption but also analysed how the number of Ethereum validators has evolved, a point worth reiterating. Since the beginning of April, there has been a substantial increase of 56.9% in the number of validators, rising from 561,268 to 880,822 (as depicted in Figure 6(a)). Concurrently, the number of Ethereum nodes experienced a growth of 23.2%, growing from 11,424 to 14,072 (as illustrated in Figure 6(b)). Furthermore, the two charts emphasise a salient point when analysing the network’s environmental impact: the significant disparity between the number of nodes and validators. This discrepancy underscores the importance of not using validators as proxies for nodes, especially when calculating electricity consumption estimates. In this context, our estimation shows that, over the same approximately eight-month period, the network’s annual electricity consumption increased by 21.2%, from 6.19 GWh to 7.50 GWh. This figure can roughly be compared with the annual electricity consumption of slightly more than 2,000 English households.14
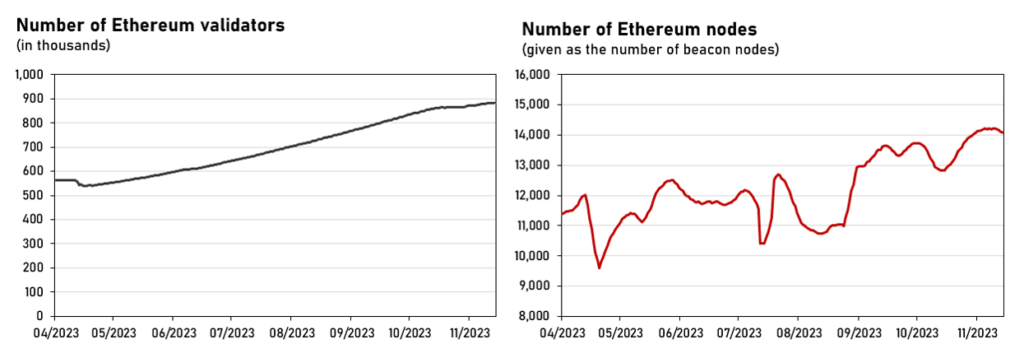
Figure 6: as of 14/11/2023, this figure shows (a) the number of Ethereum validators that have completed the activation queue, and (b) the number of discovered Beacon nodes. | Source: Coin Metrics, MigaLabs
Turning our attention to the geographical distribution, as depicted in Figure 7(a), it is evident that the distribution of Ethereum nodes post-Merge noticeably differs from its distribution during the PoW era, as well as from that of Bitcoin. Both Europe and North America show a marked dominance in the post-Merge landscape, with Europe accounting for 43.3% and North America for 40.5%, collectively constituting 83.8% of all Ethereum nodes. Further analysis, as illustrated in Figure 7(b), reveals that 64.6% of nodes are concentrated in just five countries. The United States leads with the largest share at 37.2%, followed by Germany (14.6%), Finland (4.9%), the UK (4.3%), and France (3.6%). Considering the top ten countries, the cumulative share of Beacon node activity reaches 78.6%. The concentration of nodes in specific jurisdictions has provoked reactions from regulators about their authority over Ethereum transactions,15 which have been met with criticism due to concerns about the implications this could have on the network’s resistance to censorship.16
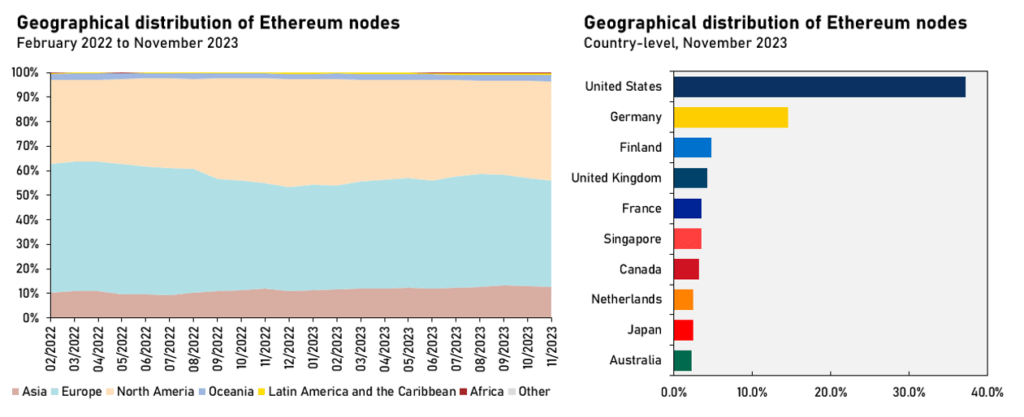
Figure 7: as of 14/11/2023, this figure illustrates (a) the geographical distribution of Beacon nodes from February 2022 to November 2023, grouped into seven regions, and (b) the geographical distribution at country-level for November 2023. | Source: MigaLabs
A review of Figure 7(a) and Figure 1 reveals a pronounced difference in the historical and current geographical distributions of mining nodes and Beacon nodes, respectively. The subsequent analysis investigates the technical intricacies and different underlying economic incentive structures of PoW and PoS, which offers an explanation for this disparity. Although both systems facilitate distributed consensus, their operational approaches are inherently distinct.
The PoW mechanism is founded on its capability to yield incontrovertible evidence of resource expenditure. At the heart of PoW is the requirement to solve cryptographic puzzles, which entails generating a block hash that conforms to a predetermined difficulty level. This process, impervious to shortcuts via logical deduction, requires a brute-force, trial-and-error approach, thus demanding considerable computational effort. Yet, once a miner discovers a valid solution, the solution can be easily verified by others. The requisite computational power translates into financial costs for the miners. These costs are incurred through capital expenditures, such as hardware procurement, and operational expenditures, including electricity costs, regardless of whether block rewards are received or not. Conceptually, mining resembles a competitive race where the reward is granted exclusively to the first miner who finds a valid solution to the cryptographic puzzle. Furthermore, a violation of protocol rules, such as illegitimately increasing one’s block subsidy beyond the 6.25 BTC (third halving), would lead to the forfeiture of rewards, as the block would be rejected by honest nodes. This setup ensures network security by making rule adherence the most rational choice for participants, in line with game theoretical principles.
Having established the security framework underpinning PoW, it is critical to explore the alternative mechanism offered by PoS, which presents a paradigm shift in how consensus is achieved and maintained in a decentralised network. Unlike the computationally intensive process of PoW, PoS discourages malicious behaviour by requiring validators to lock in collateral – referred to as ‘stake’. This approach ensures that validators have a financial incentive to act honestly; misbehaviour leads to a tangible financial penalty, such as the loss of a portion of their stake. This system of incentives and penalties aligns the validators’ interests with the network’s integrity, creating a Nash Equilibrium where the most rational, self-beneficial action for each participant also promotes the overall health and security of the blockchain.
The shift from energy-intensive PoW to PoS opens the door for participants in regions with prohibitive electricity costs – often encountered in European countries. For example, as of March 2023, business electricity rates are approximately $455/MWh in Germany, $207/MWh in Finland, and $437/MWh in the United Kingdom. In contrast, rates in historically dominant mining nations like Russia ($84/MWh), Kazakhstan ($63/MWh), and China ($87/MWh) are markedly lower.17 Economies of scale further level the playing field, as individual stakers typically operate around 4 validators per node, while professional staking entities often manage around 600 validators per node,18 thus rendering operational costs a relatively minor concern.
To illustrate this point, consider a simplified scenario involving a solo staker: an Annual Percentage Rate (APR) of 4.31%,19 an ETH price held constant at $1,956.5,20 a NUC (Next Unit of Computing, a small-form-factor personal computer) with an 83W power draw – operating non-stop throughout the year –21 and an electricity rate of $455/MWh. In this scenario, the cost-to-revenue ratio for operating one validator is 12.3%. This ratio falls to 3.1% with four validators and further declines to 1.2% with ten validators. Therefore, operational expenses remain comparatively marginal, irrespective of geographical location.
A new era: quantifying Ethereum’s post-merge climate impact
Equipped with a refined understanding of the geographical distribution of node activity, we now integrate this data to examine the resulting environmental impact (see Figure 8). Drawing parallels with our prior PoW analysis, we present three scenarios: our most reliable emissions estimate (represented by the orange line) is accompanied by two hypothetical scenarios that establish theoretical upper and lower limits. The upper-bound, or worst-case scenario, assumes that all nodes exclusively utilise electricity from coal-fired power plants (grey line). Conversely, the best-case scenario (blue line) presumes all nodes are powered by hydropower.
From our initial data point (12 December 2021), we estimate that cumulative emissions for the Ethereum PoS network stand at approximately 2.5 KtCO2e (see Figure 8(a)). Under the coal-fired power-only scenario, this figure would rise to 6.8 KtCO2e, whereas it could drop to as low as 0.1 KtCO2e with universal hydropower adoption. Our current annualised projection estimates network responsibility for 2.8 KtCO2e in emissions (see Figure 8(b)). To contextualise, this would equate to the emissions from 5 round-trip airplane flights from London to New York, the annual energy consumption-related emissions of 450 UK households, or the annual carbon sequestration capacity of 270 acres of forest.22
Comparing the final pre-Merge GHG emissions estimate of 10.3 MCO2e (Figure 5(b)) with the latest post-Merge figure of 2.8 KtCO2e still reveals a significant reduction of about 99.97%, despite a substantial increase in the number of Ethereum beacon nodes. Furthermore, our latest electricity mix estimate suggests that the network is now powered by nearly 48% sustainable energy (32% renewables and 16% nuclear), with wind power being the predominant renewable energy source, contributing 12%. Among the remaining 52% from fossil fuels, natural gas, coal-fired power, and oil constitute 30%, 19%, and 3%, respectively.
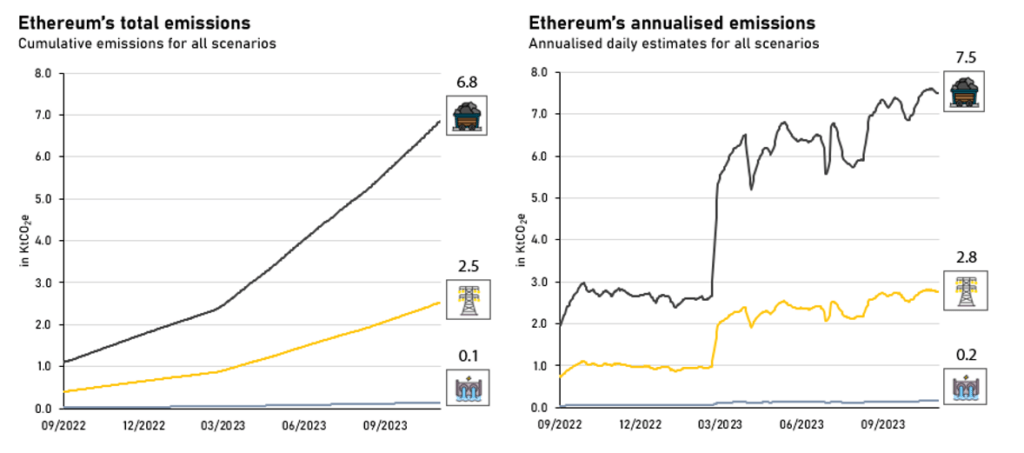
Figure 8: as of 14 November 2023, this figure presents (a) the total cumulative Ethereum GHG emissions since 12 December 2021, the first data point available to us, and (b) the annualised Ethereum GHG emission estimates since 15 September 2022. | Source: CCAF
Technological paradigm shift: will Bitcoin follow Ethereum’s path?
The Ethereum Merge marked a significant shift in the blockchain’s security model, transitioning from PoW to PoS and fundamentally altering consensus achievement. This development naturally raises the question of whether Bitcoin might embark on a similar trajectory. In this analysis, we briefly delve into the consensus mechanisms of both Ethereum and Bitcoin, assessing their impacts on network security, energy consumption, and community ethos.
One of the key drivers for Ethereum’s shift to PoS were environmental concerns over PoW’s resource-intensive nature.23 In PoW, blockchain security is maintained through miners solving cryptographic puzzles, necessitating high computational power and significant energy usage. Ethereum’s shift to PoS fundamentally alters this dynamic, as validators are now randomly selected to create new blocks, thereby drastically reducing the network’s energy intensity.
Conversely, the Bitcoin community, albeit not homogeneous,24 predominantly upholds its commitment to PoW, a choice deeply ingrained in the foundational ethos of decentralisation and a belief in tying network security to the physical realm.25 Unlike PoS-based systems, where network security is intrinsically linked to the price of a network’s native token – an endogenous factor,26 Bitcoin’s security model is anchored in the consumption of real-world resources, an exogenous factor.27 This approach firmly connects the network’s integrity to quantifiable external economic activities, underlining a key aspect of Bitcoin’s foundational principles.
Centralisation concerns are paramount in both systems but manifest differently. In PoS-based models’ access and wealth of participants play a decisive role in the centralisation of power. Access, in this context, means that participants must first own the network’s native tokens to earn more, as these tokens are required for staking. Wealth influences the centralisation of power because the likelihood of being selected to propose a block typically increases with the size of the stake.28 High minimum staking requirements can potentially aggravate this issue by acting as an entry barrier.29 The emergence of staking services has ostensibly democratised participation by lowering entry barriers, but, in turn, may lead to large staking pools wielding significant influence,30 thus only somewhat alleviating centralisation risks and further may expose participants in such pools to, for instance, counterparty risk.31
PoW-based mechanisms, conversely, face centralisation through mining pools. While entry barriers are low, as mining does not require the possession of any native tokens and can be performed with virtually any device with a CPU, this does not mean that such an action is economically sensible.32 The likelihood of being the first who solves a block, thereby attaining the right to receive the block reward, requires a substantial amount of computational power, effectively forcing smaller miners to join mining pools.33 Yet, a balancing factor is that miners retain in full control of their ‘assets’, i.e., hardware, at all times and can, de facto, instantly redirect their hashrate should they desire to do so.34 History has shown that this can be a highly effective deterrent against pools behaving in a manner detrimental to participant expectations.35
In summary, the contrasting centralisation challenges experienced in PoW and PoS reflect distinct systemic governance and security concerns, with continuous community and technical efforts to mitigate the formation of oligopolistic tendencies and uphold decentralisation.36,37 While Ethereum’s pivot to PoS effectively addresses concerns around energy use and operational efficiency, applying this model one-to-one to Bitcoin is not as straightforward as it might appear at first glance, given the substantial technical, economic, and ideological hurdles involved. Many in the Bitcoin community seem to view PoW as a cornerstone of the network’s identity,38 based on a security model deeply intertwined with the physical world,39 rendering a similar shift to PoS unlikely in the foreseeable future.
The narrative of Ethereum and Bitcoin’s different paths is not just a tale of technological advancements but also reflects different ideologies and priorities of their communities, highlighting the multifaceted complexity inherent in the evolution of leading blockchain networks.
A glance into the future
The intensifying debate around the sustainability of the digital asset ecosystem prompted us to expand our research scope, now extending beyond the confines of Bitcoin. This strategic broadening is designed to equip the public, industry stakeholders, policymakers, and regulators with foundational data, fostering an informed and balanced dialogue on this pivotal subject.
The introduced update represents a significant enhancement of our initial research, first released in April. While the previous report focused on Ethereum’s electricity consumption, this update delves into greenhouse gas (GHG) emissions, offering a more holistic view of the network’s environmental footprint.
But by no means does our commitment to this research domain end with the current findings. Looking ahead, we aim to continually refine our methodologies and improve data quality. This ongoing effort will involve forging new partnerships and broadening our analytical capabilities to provide more granular insights into Ethereum’s underlying infrastructure.
The next phase of our research agenda will see the enhancement of the Cambridge Bitcoin Electricity Consumption Index (CBECI). A notable development in this direction is the integration of a carbon accounting tool, designed to enable users to assess their individual share of Bitcoin’s emissions based on their interactions with the network. Additionally, we acknowledge the evolving landscape of cryptocurrency mining and the need for updated insights. The current Bitcoin Mining Map, last revised in January 2022, likely does not reflect the recent shifts in the mining sector. We anticipate seeing noticeable changes in the mining landscape in our next release, tentatively scheduled for Q1 2024, depending on the availability of new data.
Simultaneously, we are exploring an emerging body of literature that sheds light on the potential positive externalities of cryptocurrency mining.40 While negative environmental externalities have been comparatively well studied, research on environmental and societal benefits is still scant. However, to present a balanced perspective, weighing both the negative and positive impacts of cryptocurrency mining is crucial. Therefore, we will increase our efforts to integrate bottom-up data that helps to refine our electricity mix estimates and further explore various facets, including the role of mining in the electric power system,41 the broader energy system,42 its potential in methane mitigation,43 and its function as an additional incentive or even catalyst for renewable energy infrastructure development.44 On the other hand, we will also investigate negative externalities that were previously outside the scope of our research, such as e-waste45 and water consumption.46
In addition to these research endeavours, we have implemented enhancements to our website and tools. Recent updates include the introduction of a ‘network switch’ feature on our website to enable a more seamless transition between Ethereum and Bitcoin Moreover, we added performance data for newly released SHA-256 ASIC mining devices. Our website’s FAQ section, which offers a wealth of information on blockchain-related topics, has also been revised and expanded.
As the Cambridge Centre for Alternative Finance (CCAF) continues its collaborative efforts to refine these analytical tools, we remain open to and appreciative of constructive feedback from the ecosystem. Stakeholders are encouraged to engage with our team through the contact form available on the ccaf.io website as we strive to provide the most up-to-date and comprehensive insights into the evolving digital assets landscape.
We also want to take the opportunity to express our sincere gratitude to Invesco for their ongoing support in our digital tool development.
About the Cambridge Digital Assets Programme
This is the latest in a series of research outputs released under the Cambridge Digital Assets Programme (CDAP) umbrella.
The CDAP is a multi-year research initiative hosted by the Cambridge Centre for Alternative Finance (CCAF) in collaboration with 17 prominent public and private institutions.
The Programme seeks to provide the datasets, digital tools and insights necessary to facilitate a balanced public dialogue about the opportunities and risks presented by a growing digital asset ecosystem, with the ultimate objective to help inform evidence-based decision-making and regulation through open-access research.
The CDAP’s institutional collaborators are (in alphabetical order):
- Bank for International Settlements (BIS) Innovation Hub
- British International Investment (BII)
- Dubai International Finance Centre (DIFC)
- Euroclear
- EY
- Fidelity
- UK Foreign, Commonwealth & Development Office (FCDO)
- Goldman Sachs
- Inter-American Development Bank (IDB)
- International Monetary Fund (IMF)
- Invesco
- Mastercard
- MSCI
- NatWest
- Swiss State Secretariat of Economic Affairs (SECO)
- Visa
- World Bank
Article references
1 Buterin, V. (2017) “A prehistory of the Ethereum protocol.” Vitalik.ca.
2 Yap, R. (2018) “ASIC resistance is still worth the fight for egalitarian mining, this time with merkle tree proofs (MTP).” CryptoSlate.
3 McDonald, K. (2022) “Ethereum Emissions: A Bottom-up Estimate.” arxiv.org
4 Silva, P., Vavricka, D., Barreto, J. and Matos, M. (2020) “Impact of geo-distribution and mining pools on Blockchains: a study of Ethereum”. 2020 50th Annual IEEE/IFIP International Conference on Dependable Systems and Networks (DSN) (pp.245–252).
5 Cambridge Centre for Alternative Finance (n.d.). Cambridge Bitcoin Electricity Consumption Index (CBECI). ccaf.io.
6 Sigalos, M. (2021) “China is kicking out more than half the world’s bitcoin miners – and a whole lot of them could be headed to Texas.” CNBC.
7 (2022) World Resources Institute. Climate Watch Historical GHG Emissions.
8 Mills, E., Bourassa, N., Rainer, L., et al. (2019) “Toward greener gaming: estimating national energy use and energy efficiency potential.” The Computer Games Journal, 8(1), 157–178.
9 Partz, H. (2018) “Ethereum devs publish upgrade proposal to move network away from mining-related issues.” Cointelegraph.
10 Neumueller, A. (2023) “New tool estimates environmental impact of blockchain networks” News & insight – Cambridge Judge Business School.
11 (2023) “Scaling Ethereum” Ethereum.org
12 Young, S.K. and S.D. (2022) “Scaling Ethereum beyond the merge: danksharding.” www.coindesk.com
13 (2023) “From sharding to danksharding: the evolution of scalability solutions.” 1inch Network
14 Department for Business, Energy & Industrial Strategy. (2020) Subnational electricity and gas consumption statistics: regional and local authority Great Britain 2019.
15 Lutz, S. (2022) “SEC claims all of Ethereum falls under US jurisdiction.” Decrypt. Retrieved from
16 Jha, P. (2022) “Ethereum at the center of centralization debate as SEC lays claim.” Cointelegraph
17 GlobalPetrolPrices.com (n.d.) Electricity prices for business, March 2023. Retrieved from
18 Rated Labs (2023) “Network Overview | Ethereum Mainnet.” Rated.network
19 Rated Labs (2023) “Network Overview | Ethereum Mainnet.” Rated.network
20 CoinGecko (n.d.) “Ethereum (ETH) price, marketcap, chart, and info.” CoinGecko
21 Ganesh, T.S. (2023) “Intel NUC 12 Pro Wall Street Canyon Kits review: Alder Lake in UCFF Avatar.” www.anandtech.com Assumption: average of 7 tested NUCs in load scenario.
22 Footnote: Please visit the comparison segment on our website for the sources and descriptions.
23 (2023) “Ethereum vision.” Ethereum.org
24 Kuhn, D. (2023). “The Blocksize Wars revisited: how Bitcoin’s civil war still resonates today.” www.coindesk.com
25 Strolight, T. (2022) “Proof of work vs. proof of stake.” Swan Bitcoin
26 Buterin, V. (2020) “Why proof of stake (Nov 2020).” Vitalik.ca
27 Alden, L. (2021) “Bitcoin’s energy usage isn’t a problem. Here’s why.” Swan Bitcoin
28 Footnote: In Ethereum, for instance, this manifests as operating multiple validators rather than having a single larger stake.
29 Gilbert, A. (2022) “Lido Co-Founder’s comments spark debate over decentralization of of Ethereum” Thedefiant.io.
30 Kessler, S. and Young, S. D. (2022) “Is Ethereum staking pool Lido’s growth an omen of centralization?” coindesk.com
31 Nansen (2022) “Crypto staking, explained – the complete guide [2023].” nansen.ai
32 Cointelegraph (n.d.) “What are the different ways to mine cryptocurrency?” Cointelegraph
33 Koopsen, M. (2023) “Solo Bitcoin miner solves block with hash rate of just 10 TH/s, beating extremely unlikely odds.” Yahoo Finance
34 Kimmell, M. (2022) “CoinShares.” Coinshares.com
35 Wan, S. (2022) “Bitcoin mining pool Poolin in distress following liquidity crisis.” CryptoSlate
36 Buterin, V. (2023) “Should Ethereum be okay with enshrining more things in the protocol?” Vitalik.eth.limo
37 Rivi, F. (2023) “Why Bitcoin mining needs Stratum V2.” Bitcoin Magazine – Bitcoin News, Articles and Expert Insights
38 Hasu (2020, November 10) “Exploring Bitcoin’s core values and why we defend them.” Deribit Insights. Retrieved from https://insights.deribit.com/market-research/exploring-bitcoins-core-values-and-why-we-defend-them/
39 Highside, R. (2019) “Proof-of-work, the fundamental laws of physics and nature.” The Bitcoin Times
40 Ibañez, J.I. and Freier, A. (2023) “Bitcoin’s carbon footprint revisited: proof of work mining for renewable energy expansion.” Challenges, 14(3): 35
41 Menati, A., Zheng, X., Lee, K., Shi, R., Du, P., Singh, C., and Xie, L. (2023). “High resolution modeling and analysis of cryptocurrency mining’s impact on power grids: carbon footprint, reliability, and electricity price.” Advances in Applied Energy, 10: 100136
42 Mellerud, J. and Helseth, A. (2022) “Repurposing waste heat from bitcoin mining can lower heating costs and mitigate emissions.” K33.com/Research
43 Campbell, D. and Larsen, A. (2023) “Bitcoin and the energy transition: from risk to opportunity.” Institute of Risk Management
44 Lal, A., Zhu, J. and You, F. (2023) “From mining to mitigation: how Bitcoin can support renewable energy development and climate action.” ACS Sustainable Chemistry & Engineering, 11(45): 16330-16340
45 de Vries, A. and Stoll, C. (2021) “Bitcoin’s growing e-waste problem.” Resources, Conservation and Recycling, 175: 105901
46 Chamanara, S., Ghaffarizadeh, S.A. and Madani, K. (2023) “The environmental footprint of Bitcoin mining across the globe: call for urgent action.” Earth’s Future, 11(10)
Related articles

Research centre news
CERF at 25: milestone is celebrated at Cambridge Judge
The 25th anniversary of the Cambridge Endowment for Research in Finance (CERF) was celebrated at a 2-day conference at Cambridge Judge Business School that highlighted the research and scholars that CERF has supported over the last quarter-century. Founding benefactors William and Weslie Janeway were among the distinguished guests, who also included Professor Deborah Prentice, Vice-Chancellor of the University of Cambridge, and Professor Gishan Dissanaike, Dean of Cambridge Judge.

Research centre news
Your degree: investment or insurance policy?
Pick up any careers guide and you will find the same reassuring arithmetic: stay in education longer, earn more money. It is a comforting equation, and for generations it has nudged millions of young people toward lecture halls and library desks. But what if that calculation is not just incomplete – what if it is asking entirely the wrong question?

Research centre news
When fewer shareholders vote, each vote matters more
Shareholder voting is meant to be the cornerstone of modern corporate governance. It is the mechanism through which investors approve directors, scrutinise pay, and respond to major strategic decisions. In principle, unless there is a dual-class structure, each share carries one vote, and control should reflect formal ownership. In practice, however, many shareholders do not vote.