by Thies Lindenthal and Kahshin Leow, Department of Land Economy, University of Cambridge
Attempts to predict stock market returns are as old as the stock markets themselves. However, for today’s efficient markets, one would expect predictability to be nearly non-existent. But the reality is more dynamic, driven by an arms race of data availability, empirical innovation and market efficiency.
Enter the brave new world of machine learning (ML), which has ignited another wave of academic research on asset return predictability. ML algorithms are especially adept at handling the complexities of financial data, notably non-linearities and interactions between predictors. The seminal paper by Gu et al (2020) showcased this strength. They found that ML algorithms, such as random forests and neural networks, have an edge over traditional linear models in predicting next month’s return for US stocks. They achieved a modest, yet positive, out-of-sample R2 of 0.3–0.5%.
For bonds, the predictability is an order of magnitude higher. Bianchi et al. (2021) report out-of-sample R2 values as large as 5% for bonds. Additionally, Leippold et al. (2022) indicated that in less-efficient Chinese stock market, the predictive power of ML models reaches out-of-sample R2 values of up to 3%. Notably, these predictions remain economically significant even after accounting for transaction costs.
Kahshin Leow and I contribute to this growing literature with an analysis of Real Estate Investment Trusts (REITs). REITs are interesting to study since their returns depend, ultimately, on the performance of the properties they own. If these assets produce predictable returns then one might also see predictability at the fund level. Using stock market information (CRSP) and a selection of macroeconomic variables, we conduct a horse race in which various empirical models compete to predict the returns of all REITs traded on US exchanges from 1990 to 2022. We find that the predictability of REIT returns sits between that of general stocks and bonds, as our models achieve out-of-sample R2 ranging between 0.5-3%, depending on the selected time frame (Table 1).

Table 1: Monthly out-of-sample REIT-level prediction performance (percentage R2oos)
Notes: This table reports monthly Roos for the entire panel of REITs and stocks using OLS with all variables (OLS), OLS using only size and book-to-market (OLS-2), OLS using only size, book-to-market, and momentum (OLS-3), least absolute shrinkage and selection operator (LASSO), elastic net (ENet), principal component regression (PCR), random forest (RF), gradient boosted regression trees (GBRT), extremely randomised trees (ERT), and neural networks with one to five layers (NN1–NN5). In addition, we add the corresponding numbers for the US stock market as analysed in Gu et al. (2020). All the numbers are expressed as a percentage.
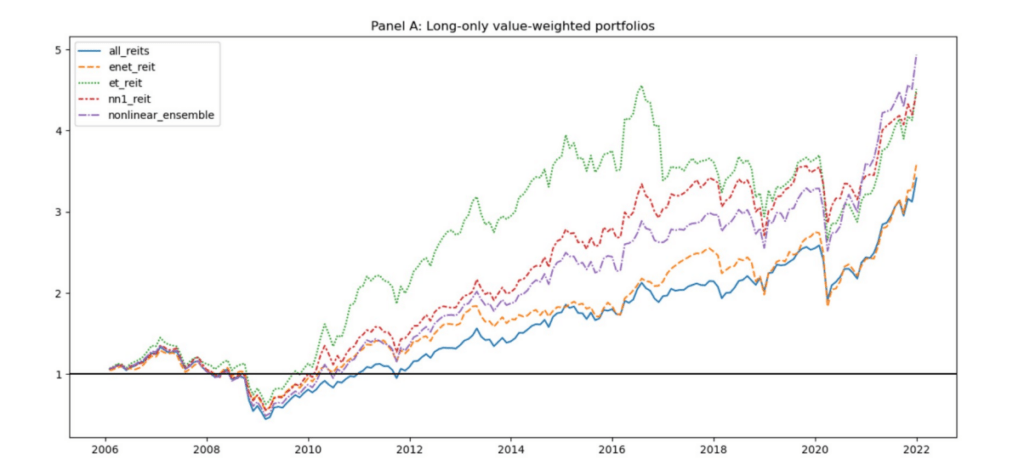
Although the predictive power of these models may appear modest at first glance, their impact on portfolio optimisation is sizeable. Allen et al (2019) emphasised the importance of even slight predictive advantages. In our study, portfolio returns improved significantly when REITs were selected based on predicted performance, both in long-only and long-short portfolios (Figure 1).

Figure 1: Cumulative return of ML portfolios (value weighted)
Notes: This figure shows the cumulative returns of the best performing machine learning portfolios. The portfolios are based on a long-only strategy of holding REITs in the top 30% quantile, and the benchmark portfolio is the weighted index of all REITs in the sample period.
This predictability also enhances the optimisation of mean-variance portfolios, in line with Markowitz’s (1953) demand that “we must have procedures for finding reasonable μi and σij. These procedures should combine statistical techniques and the judgment of practical men”. Our results showed that portfolios where we update stock mean expectations based on ML predictions outperformed naive 1/n portfolios (Table 2).
Are these results large enough to trade on it? We are not sure yet. What we are confident of, however, is that REITs returns are more predictable than previously thought, especially in times of high heterogeneity of REIT returns as, for instance, seen in 2020/21.

Table 2: Performance of machine learning portfolios using mean-variance optimisation
Notes: This table reports the out-of-sample performance measures for the best performing machine learning models using mean-variance optimisation. The naive strategy involves holding a portfolio weight of 1/N in each of the N REITs. In Panel A, the mean-variance portfolios are constrained to long-only positions to allow for an apples-to-apples comparison to the naive 1/N portfolio. In Panel B, the mean-variance portfolios are permitted to take long-short positions. “Avg” : average realised monthly return(%). “Std”: the standard deviation of realised monthly returns(%). “S.R.”: annualised Sharpe ratio. “T-stat”: t-statistic of realised monthly returns. “Skew”: skewness. “Kurt”: kurtosis. “MaxDD”: the portfolio maximum drawdown (%). “Max 1M Loss”: the most extreme negative realised monthly return(%). “Corr”: correlation of realised monthly returns against the naive 1/N portfolio returns.
Related articles
Research centre news
Do our personal experiences of local house price growth influence our consumption decisions?
Do our personal experiences of local housing price growth influence our consumption decisions? Benjamin Appianin, Research Associate at Cambridge Centre for Finance (CCFin) and Cambridge Endowment for Research in Finance (CERF), helps answer this question by showing that households spend more (less) on nondurables and services when they have experienced higher (lower) house price growth in their locality.
Research centre news
How labour unions shape the quality of CSR reporting
Cambridge Judge Associate Professor and Cambridge Endowment for Research in Finance (CERF) Research Fellow Dr Jenny Chu looks at how labour unions influence the quality of corporate social responsibility (CSR) reporting, shedding light on the strategic role of non-financial disclosure in managing labour relations.
Research centre news
Distributed public economics and decentralised public finance via network optimisation
Explore our study on optimising decentralised public finance, focusing on efficient allocation of public goods across regions to enhance overall welfare.


