

by Alexander Neumueller, Research Lead – Climate Aspects, Cambridge Digital Assets Programme
Blockchain sustainability beyond Bitcoin: Ethereum under the microscope
Bitcoin is often at the heart of the debate about the environmental impact of cryptoassets, but does it reflect the real scope of this multifaceted topic? This is the question we tackle with the release of the Cambridge Blockchain Network Sustainability Index (CBNSI). It is a new digital tool that provides cutting-edge insights into the environmental footprint of blockchain networks other than Bitcoin, beginning with an in-depth study of Ethereum’s electricity use from a contemporary and historical perspective.
The history and the future of our research
Over the last few years, blockchain technology has been a subject of heated debate, primarily driven by the environmental footprint of Bitcoin. Although blockchain is Bitcoin’s underlying technology, it has many other applications. Unfortunately, distinctions are not always recognised in discussions. Therefore, it is imperative to conduct a more comprehensive evaluation of the environmental impact of the entire ecosystem, considering important differences.
In 2019, we at the Cambridge Centre for Alternative Finance (CCAF) launched the Cambridge Bitcoin Electricity Consumption Index (CBECI) to investigate the environmental implications of Bitcoin. These research efforts aimed to bring clarity to the space and provide relevant information and data points as a public good to inform an evidence-based debate. Soon after, we expanded the Index with multiple updates, incorporating crucial information, such as the physical location of mining activities, enabling us to convert electricity consumption to greenhouse gas (GHG) emissions. However, our research to date has focused mainly on Bitcoin. And while a thorough understanding of Bitcoin is essential to informing the environmental debate, examining the whole ecosystem’s impact on the climate is also imperative. The CBNSI is our first step in this direction and will be the cornerstone of our ongoing efforts to increase the number of blockchain networks included in the Index.
In this first iteration, the CBNSI provides information on Ethereum’s electricity consumption before and after The Merge. Our methodology for estimating Ethereum’s electricity use before this historical event is based on a techno-economic model similar in logic to what we used for Bitcoin, modified to account for Ethereum’s unique characteristics. For post-Merge estimates, we had to find a different methodological approach, as our previous method for proof-of-work (PoW) was unsuitable. We used data from the Ethereum networking layer to address this issue. Please visit our website for more information about the applied methodologies and data sources we used.
The CBNSI represents an initial effort to provide more information on Ethereum’s current and historical electricity use. Hence, its insights are not yet as detailed as those we provide for Bitcoin since the currently available data only allows us to partly assess the network’s climate impact. As noted in our last blog post on evaluating Bitcoin’s GHG emissions, it is necessary to assess numerous factors to comprehensively understand a network’s environmental footprint. And while electricity consumption is a significant element, it is only one of these factors. Consequently, further research is crucial to enhance our understanding of Ethereum’s environmental impact.
We are pleased to announce that we have already begun studying the GHG emissions of Ethereum’s electricity consumption before and after the Merge to provide more clarity in this regard. Future iterations of the CBNSI will deepen insights into existing networks and integrate other blockchain networks into the platform. In addition to expanding our existing research portfolio, we remain committed to refining existing methodologies to gradually transition from essential abstractions towards incorporating subtle nuances.
Decoding Ethereum’s evolution and its environmental implications
Ethereum, the world’s second-largest cryptocurrency by market capitalisation, has come a long way since its launch in 2015. It introduced several innovations that differentiate it from Bitcoin, the world’s first cryptocurrency. Unlike Bitcoin, which was designed as a peer-to-peer electronic cash system, Ethereum was created as a decentralised platform that allows developers to build and deploy decentralised applications (dApps) using smart contracts. Smart contracts are self-executing computer programs that automatically enforce the rules and conditions encoded in them. This new approach to blockchain technology has opened up a world of possibilities and applications previously non-viable with Bitcoin’s limited functionality.
Initially, Ethereum used a PoW-based consensus mechanism but, in a long-awaited move, transitioned to proof-of-stake (PoS). This transition, often called The Merge, is part of a series of major technical upgrades to enable decentralised scaling and tackle environmental concerns. Considered by some a defining point in the history of cryptocurrency, The Merge eventually took place, after years of research, testing and delays, in mid-September 2022.
Ethereum is the first network featured on our new digital platform and is the focus of this release. In this article, we outline our research results, starting with an overview of Ethereum’s historical power consumption up to the successful implementation of The Merge. Subsequently, we will devote a section to The Merge, where we highlight its impact from an environmental perspective and conclude with our findings on the status quo, presenting a holistic view of Ethereum’s electricity consumption. This marks our first step in demystifying the network’s climate impact.
Ethereum and proof-of-work
In the past, Ethereum relied on a PoW-based consensus mechanism to verify transactions and add new blocks. To be rewarded with ether (ETH) (Ethereum’s native token), ‘miners’ had to find a solution to a cryptographic puzzle that could only be solved by brute force (trial and error), requiring vast amounts of computational resources and, hence, energy. Until The Merge, PoW was the cornerstone in ensuring the security and integrity of the network.
Under PoW, ETH was predominantly mined using graphics processing units (GPUs) and, to some extent, application-specific integrated circuits (ASICs). While technically capable, we did not consider CPUs (central processing units) in our research, as their mining performance is inferior to that of GPUs and ASICs. Noteworthy is that Ethereum’s mining algorithm, unlike Bitcoin’s, was designed to be ASIC-resistant.1 A concern often raised regarding ASICs is the risk of centralisation, as mining activities are likely to concentrate in dedicated data centres (‘mining farms’). An ASIC-resistant protocol design should encourage fairer competition between regular (at-home) miners and those with much greater financial resources, thus fostering decentralisation.2 Nevertheless, ASICs dedicated to Ethereum’s mining algorithm started to appear but had few advantages over GPUs, at least until recently. For our research, we compiled an extensive list of Ethereum mining devices and their performance data to derive our estimates. You can find more information on our methodology and data sources used on our website.
Examining Ethereum’s pre-Merge electricity consumption
Figure 1(a) summarises our findings on Ethereum’s pre-Merge electricity consumption from 2015 to 2022. It is important to highlight that there are two bars for 2022. One represents the consumption up to 14 September (17.58 TWh), the day before The Merge, and the second shows the annualised estimate as of 14/09/2022 (21.41 TWh). As the chart illustrates, by mid-September 2022, Ethereum’s electricity consumption had already surpassed the amount it consumed for the whole of 2021 (16.40 TWh) and, therefore, would probably have been significantly higher if the entire year had been considered. Overall, we estimate that Ethereum’s consumption totalled 58.26 TWh from its inception until The Merge, a figure comparable to Switzerland’s annual electricity consumption (54.88 TWh).3
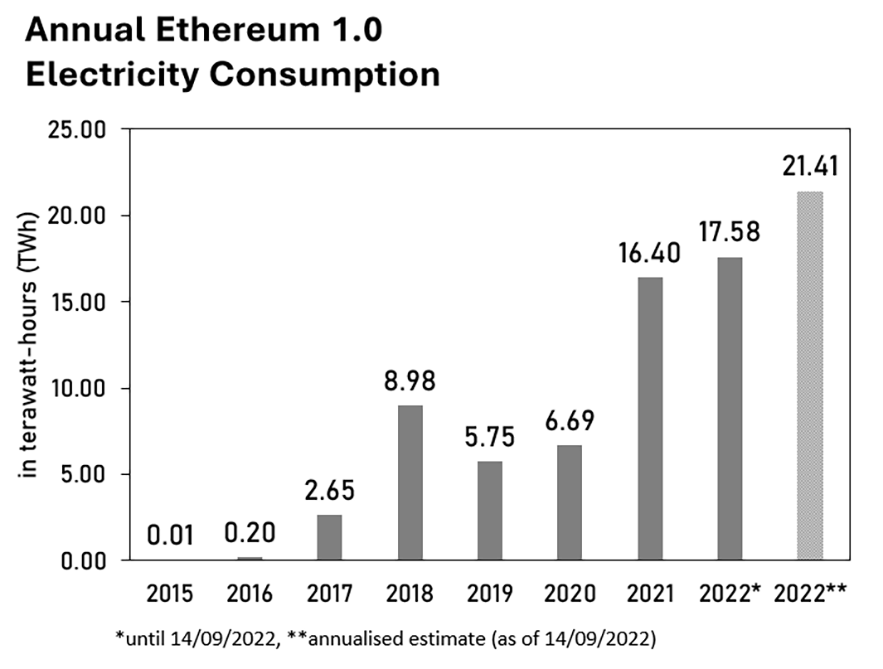
Comparing our annualised estimate of 21.41 TWh (as of 14/09/2022) with that from various other sources – McDonald K. (21.42 TWh), Crypto Carbon Ratings Institute (CCRI) (21.99 TWh) and Digiconomist (77.77 TWh) – shows close proximity between most estimates, with only Digiconomist’s estimate being significantly higher. A detailed analysis of possible reasons for these differences is beyond the scope of this article.
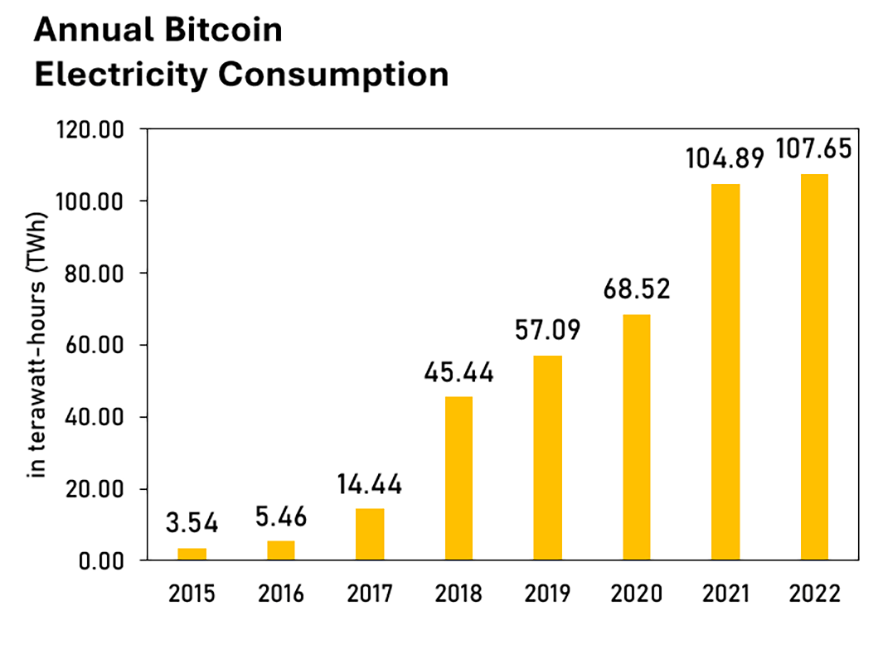
Interestingly, the trend in Ethereum’s electricity consumption is more volatile than Bitcoin’s (see Figure 1(b)). Although both networks experienced a significant increase in consumption from 2015 to 2022, there is a notable difference between 2019 and 2020. Bitcoin’s consumption increased slightly during this period, while Ethereum’s fell below its 2018 levels. Examining the data more closely reveals that this divergence is due to the different trajectories of Bitcoin’s and Ethereum’s network hashrate, as Figure 2 shows. Following a brief decrease between late 2018 and early 2019, Bitcoin’s hashrate rebounded to its previous peak by mid-2019. Conversely, Ethereum’s hashrate did not reach the same milestone until October 2020.
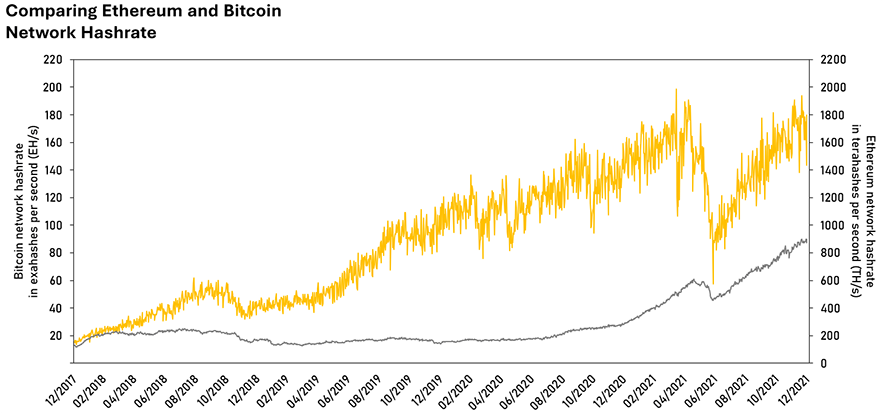
Another notable observation is that the government-mandated mining ban in China in May 2021 affected Bitcoin’s network hashrate far more severely than Ethereum’s. Specifically, Bitcoin’s hashrate plummeted by 71.1%, declining from 198.62 EH/s (pre-ban peak) to 57.47 EH/s (post-ban low) in 2021. It should be noted, however, that these figures are based on daily network hashrate data, which often fluctuates greatly for Bitcoin due to randomness in block discovery and comparatively long block time. So, for example, if we applied a seven-day average, the decrease would be smaller (53.1%) although still severe.
In contrast, the decline in Ethereum’s hashrate was much less substantial (25.5%), falling from 610.98 TH/s to 455.39 TH/s. This could indicate that Ethereum mining was likely less concentrated in China. Although Bitcoin’s hashrate gradually rebounded in the following months, ostensibly due to the prompt relocation of mining activities,4 it had not exceeded its pre-ban peak by the end of the year. Conversely, Ethereum’s hashrate not only rebounded to its pre-ban levels but had significantly increased by the end of the year, explaining the surge in Ethereum’s electricity consumption from 2020 to 2021.
The Merge
Discussions about Ethereum’s shift to a PoS-based consensus mechanism started as early as 2014.5 The first significant step toward this transition was the deployment of the Beacon Chain (consensus layer) in December 2020. From that point up until The Merge, both the consensus and execution layers ran in parallel. During this period, the only communication between these two chains involved inflows on the Ethereum staking smart contract on the execution layer, allowing these funds to be replicated on the Beacon Chain. Both blockchains still had their own distinct methods of reaching consensus. It was only nearly a decade after the initial discussions, on 15 September 2022, that Ethereum successfully underwent the transition – The Merge – which fundamentally altered the network’s architecture.
As outlined earlier, in PoW, network participants who propose blocks must demonstrate unforgeable proof (a valid block hash) that they have spent computational resources. Conversely, PoS does not require such proof but instead requires participants to put financial resources at stake. Ethereum requires those who participate in proposing new blocks and providing attestations (so-called validators) to pledge 32 ETH as collateral. If a validator behaves negligently or maliciously, knowingly or unknowingly, they will not be compensated for network services rendered. In more severe cases, the network will impose a financial penalty (known as ‘slashing’) that reduces the validator’s stake (pledged collateral) accordingly.
Post-Merge, the execution layer is still responsible for executing transactions and smart contracts. This responsibility is carried out through the Ethereum Virtual Machine (EVM), a sandboxed environment that executes code in a decentralised manner across the network. Conversely, the consensus layer is now responsible for validators agreeing on which blocks are appended to the blockchain (fork choice rule) and distributing rewards for network services rendered (such as proposing or attesting blocks).
The different methods used by PoS and PoW to ensure distributed consensus have considerable implications for electricity consumption and how it can be approximated. Our research on PoW consensus-based blockchain networks follows a techno-economic model similar to the one we used to calculate Bitcoin’s electricity consumption. However, because PoS does not involve using vast computational resources to solve cryptographic puzzles, estimating the number and efficiency of the hardware employed based on electricity costs is no longer an appropriate method, as their number or computational power does not influence an operator’s revenue. Therefore, we had to devise a new approach to estimate the number and technical specifications of the hardware units employed. However, before we delve into our findings regarding Ethereum’s post-Merge electricity consumption, we will address an interesting topic in the next section: the fate of the computing power previously contributed to Ethereum. Specifically, did The Merge actually reduce the overall electricity consumption, or did other blockchain networks simply absorb the computing power?
Lastly, we want to address commonly held misconceptions surrounding The Merge, namely that the upgrade will lead to less network congestion and lower transaction fees. This is not the case, as Ethereum’s post-Merge transaction processing capacity only slightly increased. 6 However, the event marked the completion of a significant stage in the Ethereum roadmap; the latest updated version of the roadmap has been shared in a tweet by Vitalik Buterin. The next update – The Surge – aims to address the issue of scalability and significantly increase transaction throughput by introducing sharding and combining layer 1 data processing solutions with layer 2 technologies like rollups. The update will be rolled out in stages to eventually achieve a processing capacity of up to 100,000 transactions per second,7 aimed at reducing network congestion and lowering transaction fees.
What happened to the hashrate?
While many hail The Merge as a step toward a more sustainable future for Ethereum, the question remains whether this is indeed the case or if the hashrate has simply been absorbed by other PoW consensus-based blockchain networks. To investigate this further, we examined several other blockchain networks to which the hashrate could have reasonably been diverted: Ethereum Classic, EthereumPoW, Ergo and Ravencoin. Figure 3 shows the results of our investigation. Figure 3(a) shows the hashrate distribution between these four networks and Ethereum one week before The Merge. As we can see, Ethereum was responsible for more than 90% (905.97 TH/s) of the combined computational power (983.28 TH/s), with Ethereum Classic taking the second spot (48.95 TH/s). This changed drastically on 15 September.
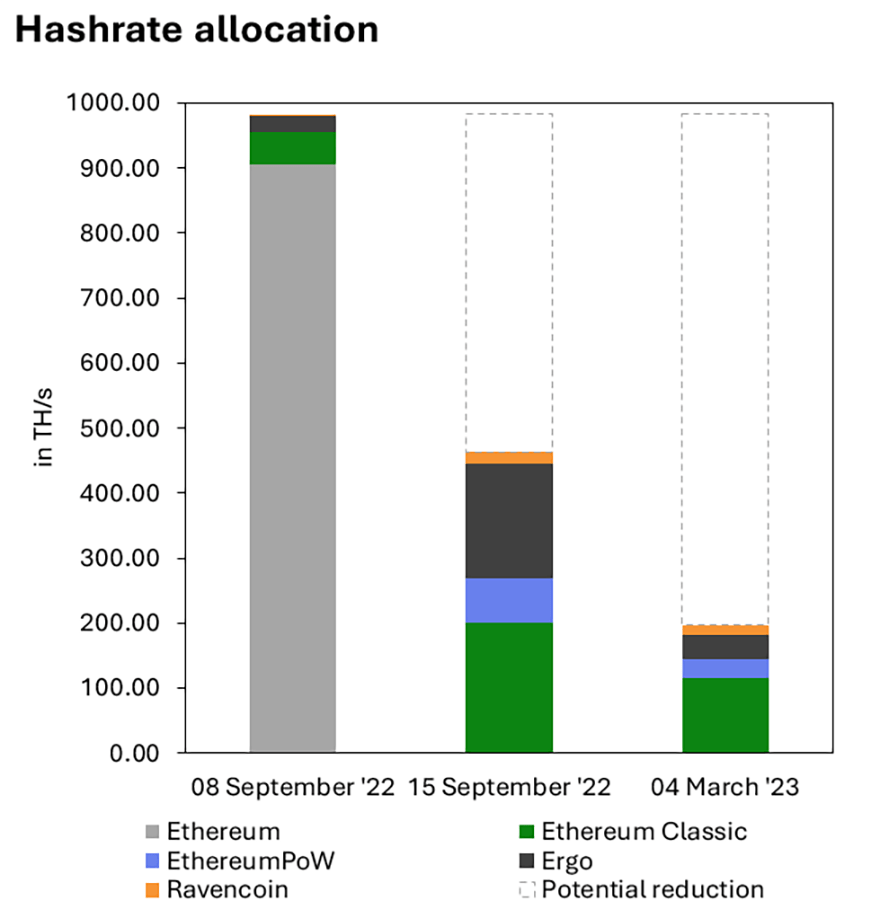
From the chart, it becomes apparent that while Ethereum’s network hashrate disappeared on 15 September, the combined hashrate of the other networks grew nearly 500% from 77.32 TH/s (as of 08/09/2022) to 463.87 TH/s. Ethereum Classic’s hashrate grew by 310.5% from 48.95 TH/s to 200.94 TH/s, Ergo showed the most significant relative gains, with its hashrate growing by 615.9% from 24.46 TH/s to 175.11 TH/s. Moreover, as Ethereum’s transition to PoS was somewhat controversial in the community,8 a fork (EthereumPoW) appeared that also absorbed a portion of the freed-up hashrate. Overall, however, when comparing the hashrate one week before The Merge with the hashrate on the day, it had already significantly dropped by over 52.8% or 519.41 TH/s, falling from 983.28 TH/s to slightly above 460 TH/s.
So, returning to the question of whether the hashrate disappeared or just shifted, it seems that The Merge did reduce mining activity overall. This becomes even more apparent when looking at what happened after The Merge. The combined hashrate of the four networks declined even further by another 57.8% from 463.87 TH/s (as of 15/09/2022) to 196.79TH/s (as of 04/03/2023), with Ergo shedding most of the hashrate gains. In total, between 8 September 2022 and 4 March 2023, nearly 80% of the hashrate seemed to have disappeared.
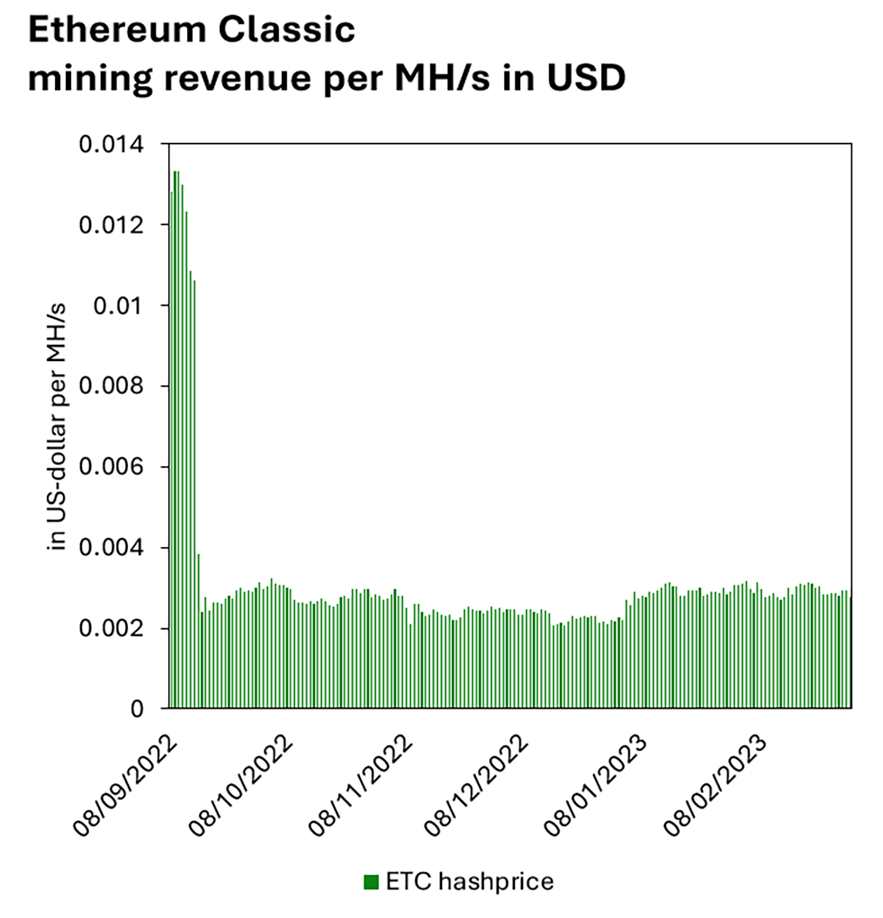
We can only speculate what happened to the mining hardware used; however, there is evidence that so much of it appeared on the second-hand market that even GPU designers and manufacturers felt the effects.9 Figure 3(b) shows a likely explanation for this development using Ethereum Classic as an example. It illustrates how the ETC mining revenue per unit of computing power (MH/s) per day evolved from just before The Merge to 4 March 2023. As can be seen, mining revenue fell sharply from close to USD0.014 per MH/s to slightly more than USD0.002 before the end of September. Since then, ETC mining revenue has oscillated between approximately USD0.002 and USD0.003. This sudden and drastic change in revenue underscores the severe impact increases in network hashrate can have on miners’ profitability if the price does not adjust accordingly. It must be said, however, that the sharp fall seen in Figure 3(b) was not only driven by a substantial increase in the hashrate but also a decrease in ETC price, adversely affecting revenue from both angles.
Another common misconception is that those who had previously mined ether could seamlessly switch to mining another cryptocurrency, for example, Bitcoin. This is not the case. While technically possible, it would be highly unprofitable. The performance results of an online benchmark test10 suggest it would take roughly two weeks, using one of the top-tier GPU models (Nvidia RTX 3090), to mine the equivalent of USD0.01 in BTC. An older device, such as the AMD HD 7970 (used for mining bitcoin in the pre-ASIC era), would take over half a year to mine the same amount, making such an operation unprofitable at any reasonable electricity price.
Examining the impact of The Merge from an environmental perspective
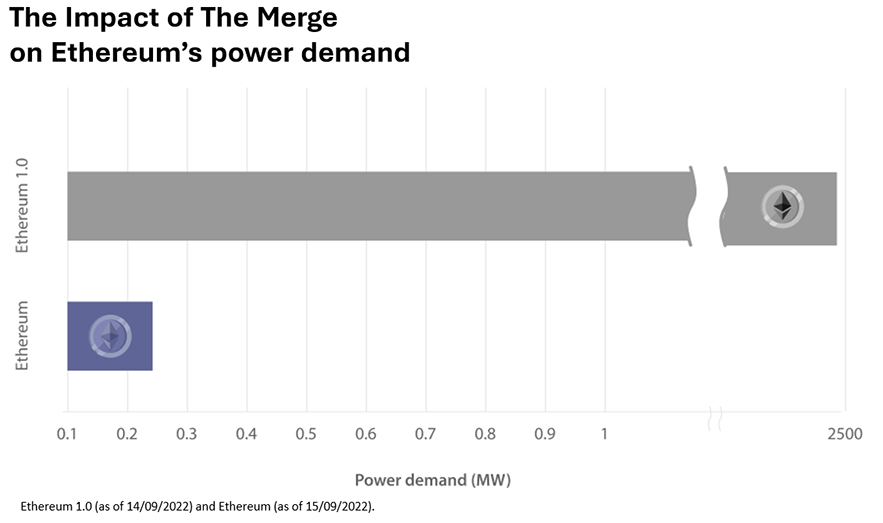
As expected, The Merge significantly changed Ethereum’s electricity use, decreasing it by a staggering 99.99% when comparing the network’s power demand of 2.44 GW (as of 14/09/2022) to our first post-Merge estimate of 224kW, as Figure 4 shows. This stark difference highlights that one of the core objectives of The Merge, namely reducing Ethereum’s dependence on computing power for its security,11 has been achieved, as evidenced by the substantial decline in estimated electricity use.
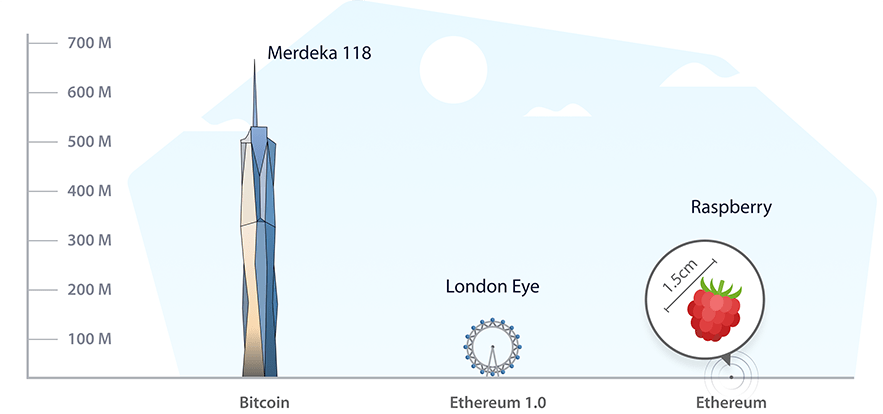
Various interactive infographics on our website help make this change relatable. For example, in Figure 5, we use the height of iconic buildings compared to the size of a raspberry as an analogy. If Bitcoin were equal to the height of the Merdeka 118 (the second-tallest building in the world), Ethereum 1.0 would be comparable to the London Eye (one of the tallest observation wheels in the world) and Ethereum in its current form would be as small as a raspberry. The segment on our website dedicated to The Merge contains more examples.
While the previous examples are devoted to examining the changes at the time of The Merge, our website also includes continuously updated estimates of Ethereum’s power demand and consumption (Figure 6(b)), as well as its cumulative consumption (Figure 6(a)). Akin to our Bitcoin research, the website also features two additional hypothetical scenarios representing the best and worst cases, marking the upper and lower bounds of Ethereum’s electricity use.
While our goal was to extend our estimates to include data from as far back as 1 December 2020, when the Beacon Chain was launched, we could not do so due to the unavailability of the number of Beacon Nodes. Consequently, we had to begin our analysis with the earliest data point available to us, which was 12 December 2021. Therefore, please keep in mind that our current estimate for 2021, shown in Figure 6, only encompasses 20 days. Also, from 6 March 2023, improvements to the network monitoring tool that provides us with data led to the discovery of a substantially higher number of nodes. This suggests that the number of nodes, and subsequently electricity consumption, might have been higher than our estimates indicate for the period before 6 March 2023.
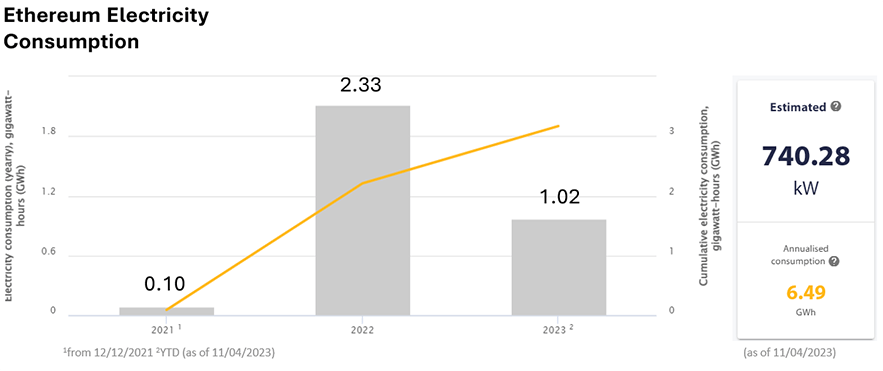
When looking at the numbers, as of 11/04/2023, we estimate that Ethereum will consume 6.49 GWh of electricity annually. We derive this figure by annualising the network power demand or, in other words, assuming that the current consumption rate continues for a year. To put this figure into perspective, we can compare it to the annual electricity consumption of iconic buildings such as the Eiffel Tower (6.70 GWh) or the British Museum (14.48 GWh) or driving 15.7 million miles in a Tesla Cybertruck. Visit our website for more information and additional examples.
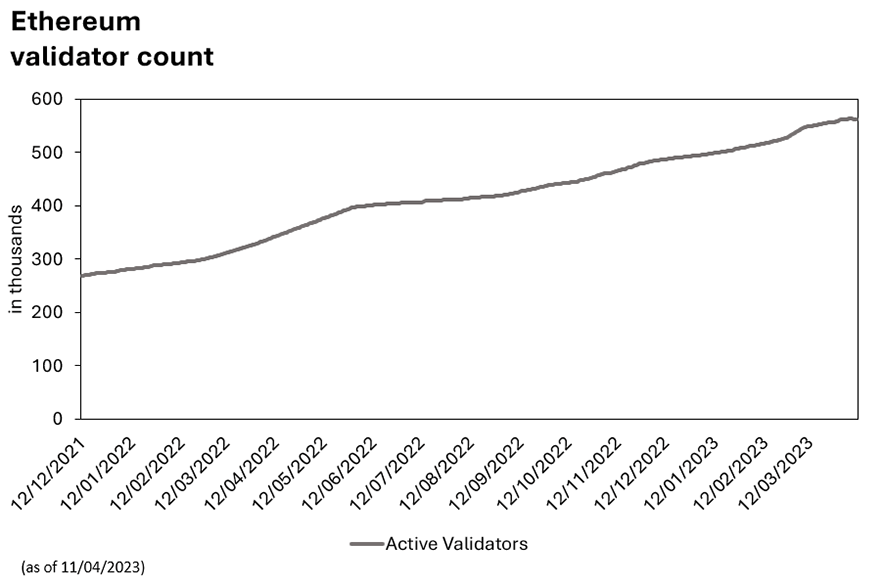
Our research shows that Ethereum’s electricity consumption has increased significantly over time, now estimated at 6.49 GWh, up from 1.78 GWh (as of 12/12/2021). However, this was to be expected as the number of identified Beacon Nodes has increased by 266.3% from 3,247 (as of 12/12/2021) to 11,892 (as of 11/04/2023). An increase in node activity does not come as a surprise considering that the number of active validators increased from 268,675 to 562,782 over the same period (see Figure 7(a)). Furthermore, as briefly touched upon earlier, the number of Beacon Nodes prior to 06/03/2023 may be understated due to the transition to the new crawler.
An issue often pointed out with respect to validators is how these are distributed among network participants. One concern is the concentration of validators among a few major entities.12 As Figure 7(b) highlights, this concern is not without merit. The 5 largest entities hold more than 60% of all validators, with the largest 3 more than 51%, which raises concerns over the potential risk of centralisation and its possible implications on the network’s censorship resistance.13
There is also some concentration of validators in terms of geographic distribution. Figure 8 shows the physical location of identified Beacon Nodes. As we can see, a high concentration of nodes exists in a handful of countries. More than two-thirds of all identified Beacon Nodes reside in only five countries: the United States contains the most (38.8%), followed by Germany (16.6%), Finland (5.0%), the United Kingdom (4.6%) and Singapore (4.0%). When considering the top ten countries, the combined share of Beacon Node activity rises to 82.6%. This concentration of nodes in certain jurisdictions has already provoked reactions from regulators about having authority over Ethereum transactions, which many have criticised amid concerns about its implications.14
An evolving index, what comes next?
The debate around electricity consumption and sustainability has gained momentum, prompting us to expand our research scope and investigate further the environmental externalities of blockchain networks other than Bitcoin. Although Bitcoin is undoubtedly at the centre of the discussion, examining other blockchain networks and providing the public, industry, policymakers and regulators with the necessary foundational data for an evidence-based debate is still essential.
The release of the CBNSI is a step in this direction by more closely examining Ethereum from historical and current perspectives. However, our insights are not yet as detailed as those we have for Bitcoin. While data on electricity use is available, it does not give a complete picture of Ethereum’s environmental footprint; although it is a key component in assessing the climate impact, it is not the only one. Therefore, further research is still required to better understand the full extent of the network’s impact.
To that end, we are already working toward providing more insights to offer a more complete picture of Ethereum’s current environmental footprint and historic emission debt. Beyond our more immediate research agenda, for both the CBECI and CBNSI, we are committed to continually revisiting existing methodologies and improving data quality to help clarify this still-novel field of research by forming new partnerships and collaborations.
Besides the launch of the CBNSI, we have added various functionalities to the CBECI and updated hardware data. These improvements range from adding an annualised electricity consumption estimate over time to the index page to adding performance data of more than 10 additional SHA-256 ASIC mining devices. Furthermore, we have revised and expanded the FAQ section on our website, providing a wealth of information on general blockchain-related topics, Bitcoin and Ethereum. A complete list of all the changes to the CBECI and CBNSI is available in the respective change logs.
The CCAF looks forward to continuing working with its partners and network to improve the Index tools and always welcomes constructive feedback and suggestions from the ecosystem. You can contact the team using the form on our website.
This is the latest in a series of research outputs released under the Cambridge Digital Assets Programme (CDAP) umbrella. The CDAP is a multi-year research initiative hosted by the CCAF in collaboration with 14 prominent public and private institutions. The Programme seeks to provide the datasets, digital tools and insights necessary to facilitate a balanced public dialogue about the opportunities and risks a growing digital asset ecosystem presents. The ultimate objective is to help inform evidence-based decision-making and regulation through open-access research.
The CDAP’s institutional collaborators are (in alphabetical order) Bank for International Settlements (BIS) Innovation Hub, British International Investment (BII), Dubai International Finance Centre (DIFC), EY, Fidelity, UK Foreign, Commonwealth & Development Office (FCDO), Goldman Sachs, Inter-American Development Bank (IDB), International Monetary Fund (IMF), Invesco, Mastercard, MSCI, Visa and World Bank.
1 Buterin, V. (2017) “A prehistory of the Ethereum protocol.” Website of Vitalik Buterin, 14 September 2017 (Retrieved 10 April 2023)
2 Yap, R. (2018, October 30) “ASIC resistance is still worth the fight for egalitarian mining, this time with Merkle Tree Proofs (MTP).” CryptoSlate, 30 October 2018 (Retrieved 10 April 2023)
3 U.S. Energy Information Administration, Country data, 2019 estimate.
4 Sigalos, M. (2021) “Bitcoin mining has totally recovered from Chinese ban.” CNBC, 10 December 2021 (Retrieved 10 April 2023)
5 Buterin, V. (2014) “Proof of stake: how I learned to love weak subjectivity.” Ethereum Foundation Blog, 25 November 2014 (Retrieved 11 April 2023)
6 Sarkar, A. (2022) “The merge: top 5 misconceptions about the anticipated Ethereum upgrade.” Cointelegraph, 13 August 2022 (Retrieved 11 April 2023)
7 Buterin, V. [@VitalikButerin] (2022) Updated roadmap diagram! [Tweet] Twitter, 4 November 2022
8 Nelson, J. (2022) “Ethereum fork EthereumPoW announces post-merge launch plans.” Decrypt, 13 September 2022 (Retrieved 11 April 2023)
9 D’Anastasio, C. and King, I. (2022) “Nvidia (NVDA) game card prices plunge along with crypto mining demand.” Bloomberg.com, 30 June 2022 (Retrieved 11 April 2023)
10 OnlineHashCrack.com (Retrieved 11 April 2023)
11 “Ethereum energy expenditure.”, ethereum.org (Retrieved 11 April 2023)
12 Gilbert, J. (2022) “Why Ethereum is more decentralized after the merge.” Blockworks, 7 November 2022 (Retrieved 12 April 2023)
13 Luo, X. (2022) “Ethereum already showing signs of increased centralization.” CoinDesk Latest Headlines RSS, 7 November 2022 (Retrieved 12 April 2023)
14 Lutz, S. (2022) “SEC claims all of Ethereum falls under US jurisdiction.” Decrypt, 19 September 2022 (Retrieved 12 April 2023)
Related articles

Finance and accounting
Integrated digital finance regulation: lessons from Kigali
Fragmentation between data protection and financial regulatory frameworks is increasing compliance burdens and slowing the development of safe, data-driven financial services. Learn what joined-up oversight would look like in practice.

Finance and accounting
Where AI meets blockchain: assets, agents and blind spots
An analysis of AI and blockchain convergence, covering compute infrastructure, crypto assets, autonomous agents and emerging policy challenges by Wenbin Wu, Research Associate at the Cambridge Centre for Alternative Finance.

Finance and accounting
Crypto privacy after sanctions – the return of coin mixers
Crypto mixers are back but different, say Wenbin Wu and Keith Bear from the Cambridge Centre for Alternative Finance (CCAF), Cambridge Judge Business School. After 2022 sanctions scattered the market, compliant privacy protocols now dominate.